Bollinger Bands Trading Strategies
Master proven Bollinger Bands trading strategies including squeeze plays, band walks, and volatility breakouts for more profitable trading decisions.

Marketing
Reviewed by Mike Christensen
Fact-checked by Mike Christensen

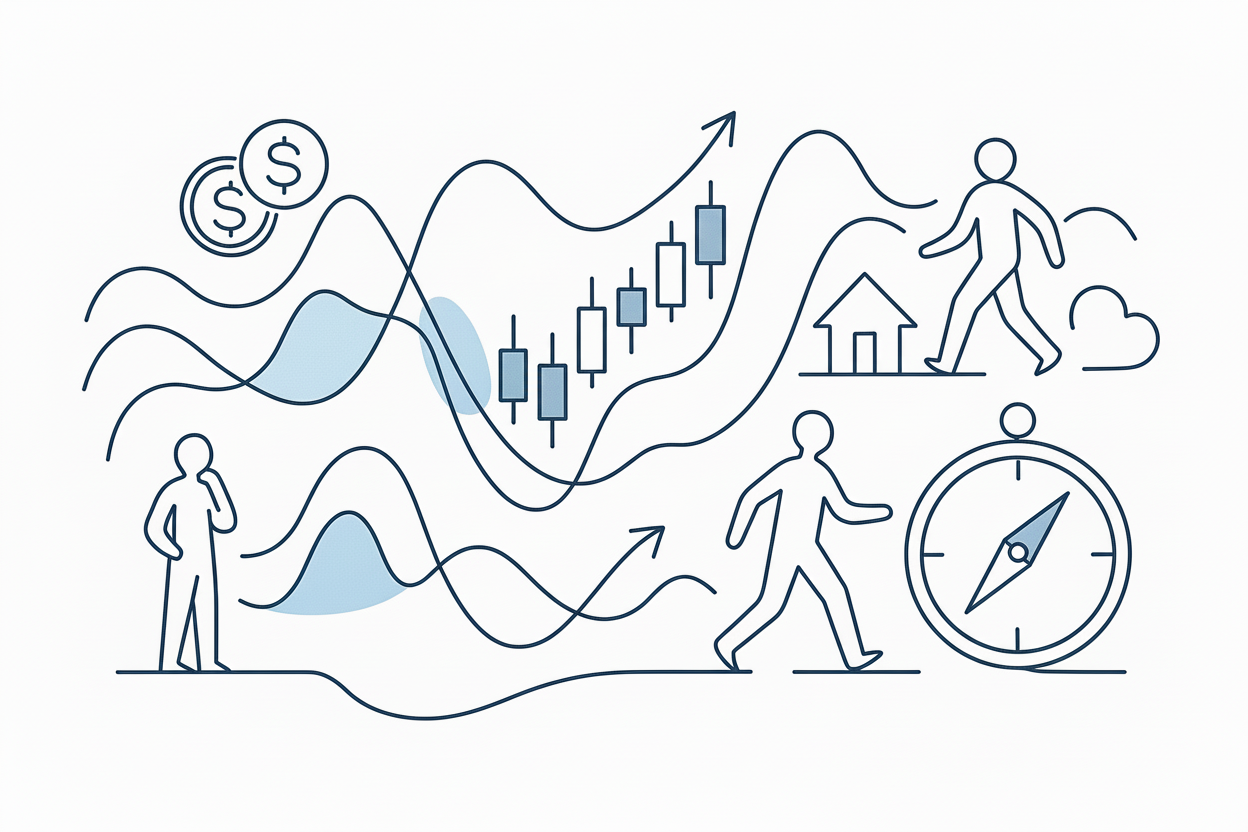
Bollinger Bands represent one of the most versatile and widely-used technical indicators in trading. Developed by John Bollinger in the 1980s, these bands provide traders with valuable insights into price volatility, potential reversal points, and trending conditions. Understanding how to effectively implement Bollinger Bands trading strategies can significantly enhance your trading performance across various market conditions.
Understanding Bollinger Band Construction
Bollinger Bands consist of three lines plotted on a price chart. The middle band represents a simple moving average, typically set to 20 periods. The upper and lower bands are calculated by adding and subtracting two standard deviations from the middle band. This mathematical construction creates a dynamic channel that expands and contracts based on market volatility.
The standard deviation multiplier of 2.0 captures approximately 95% of price action within the bands under normal market conditions. When prices move outside the bands, it suggests either a strong trending move or a potential reversal opportunity, depending on the broader market context.
Key Components and Settings
The default Bollinger Band settings work well for most trading scenarios. The 20-period moving average provides a good balance between responsiveness and smoothness. The two standard deviation multiplier creates bands that are neither too tight nor too loose for most market conditions.
Some traders adjust these parameters based on their trading timeframe and strategy. Shorter-term traders might use a 10-period moving average with 1.5 standard deviations for more sensitive signals. Longer-term investors often prefer 50-period averages with 2.5 standard deviations for broader market perspective.
The Bollinger Band Squeeze Strategy
The squeeze represents one of the most powerful Bollinger Bands trading strategies. This pattern occurs when the bands contract significantly, indicating extremely low volatility. The squeeze often precedes substantial price movements as markets transition from low to high volatility periods.
During a squeeze, the bands move closer together, sometimes converging to their tightest levels in weeks or months. This compression suggests that a significant breakout is imminent, though the direction remains uncertain until the breakout occurs.
Identifying Squeeze Conditions
Effective squeeze identification requires monitoring both the band width and the relationship between price and the middle band. True squeezes show the bands at their narrowest point relative to recent history. Price action often becomes choppy and range-bound during these periods.
Traders typically look for squeeze conditions where the band width reaches multi-week or multi-month lows. The longer the squeeze persists, the more explosive the eventual breakout tends to be. Volume often diminishes during squeeze periods, further confirming the low volatility environment.
Trading the Squeeze Breakout
The most effective approach to trading squeeze breakouts involves waiting for a decisive move beyond the bands accompanied by increasing volume. False breakouts are common, so confirmation through additional technical factors proves essential.
Successful squeeze traders often use a two-step approach. First, they identify the squeeze condition and prepare for the breakout. Second, they wait for the actual breakout with proper confirmation before entering positions. This patience helps avoid the numerous false signals that can occur during volatile periods.
Band Walk Trading Strategy
The band walk represents another powerful Bollinger Bands trading strategy, particularly effective in trending markets. This pattern occurs when prices consistently move along or near one of the bands, indicating strong directional momentum.
During an uptrend band walk, prices repeatedly touch or move along the upper band without falling back to the middle band. This behavior suggests strong buying pressure and continuation potential. Conversely, a downtrend band walk shows prices clinging to the lower band, indicating persistent selling pressure.
Recognizing Band Walk Patterns
Effective band walk identification requires understanding the difference between normal band touches and sustained band walking. Isolated touches to the bands often signal reversal opportunities, while sustained walks indicate trending conditions.
True band walks typically show prices spending multiple periods near one band while the bands themselves continue expanding or maintaining width. The middle band often acts as support during upper band walks and resistance during lower band walks.
Trading Band Walk Opportunities
Band walk trading involves entering positions in the direction of the walk and managing risk through the middle band. During upper band walks, traders often buy pullbacks toward the middle band or add to positions on continued strength along the upper band.
Risk management becomes crucial during band walk trading since these patterns can reverse suddenly. Successful traders often use the middle band as their primary stop-loss level while allowing profits to run as long as the walk continues.
Volatility Breakout Strategies
Bollinger Bands excel at identifying volatility breakouts, which occur when prices move decisively beyond the bands. These breakouts often signal the beginning of new trends or the acceleration of existing ones.
The key to successful volatility breakout trading lies in distinguishing between genuine breakouts and false signals. Genuine breakouts typically show strong volume, follow-through price action, and occur from periods of relatively low volatility.
Breakout Confirmation Techniques
Effective breakout confirmation requires multiple supporting factors beyond the simple band penetration. Volume expansion often accompanies genuine breakouts, while false breakouts frequently show diminishing volume.
Time-based confirmation also proves valuable. Breakouts that maintain their momentum through multiple periods show greater reliability than those that immediately reverse. Many traders require breakouts to close beyond the bands rather than simply touching them intraday.
Managing Breakout Trades
Successful breakout trading requires careful position sizing and risk management. Initial stops are often placed at the opposite band or the middle band, depending on the trader's risk tolerance and market conditions.
Profit targets for breakout trades often use measured moves based on the band width or previous price ranges. Some traders prefer to scale out of positions as the move progresses, while others hold for larger targets based on broader technical analysis.
Combining Bollinger Bands with Other Indicators
While Bollinger Bands provide valuable standalone signals, combining them with other technical indicators often improves trading accuracy. Momentum oscillators, trend indicators, and volume analysis can all enhance Bollinger Band strategies.
Relative Strength Index (RSI) works particularly well with Bollinger Bands for identifying overbought and oversold conditions. When prices touch the upper band while RSI shows overbought readings, reversal probability increases significantly.
Momentum Confirmation
Momentum indicators like MACD or Stochastic can provide valuable confirmation for Bollinger Band signals. Divergences between price and momentum often occur near band extremes, offering early warning signs of potential reversals.
During band walks, momentum indicators help distinguish between healthy trends and exhausted moves. Strong momentum readings support continued band walking, while weakening momentum suggests the trend may be losing steam.
Volume Analysis Integration
Volume analysis adds another dimension to Bollinger Band trading. Expanding bands with increasing volume often signal the beginning of significant moves, while contracting bands with diminishing volume suggest consolidation periods.
Volume can also help confirm breakout signals. High-volume breakouts beyond the bands show greater reliability than low-volume moves, which are more likely to reverse quickly.
Risk Management for Bollinger Band Trading
Effective risk management remains crucial for successful Bollinger Band trading. The dynamic nature of the bands requires flexible stop-loss placement and position sizing strategies.
Many traders use the middle band as their primary risk management tool, exiting positions when prices close beyond this level against their trade direction. This approach provides a logical exit point based on the indicator's construction.
Position Sizing Strategies
Position sizing for Bollinger Band trades often depends on the band width and expected volatility. During tight squeezes, smaller positions may be appropriate due to uncertain breakout direction. During clear trends with wide bands, larger positions might be justified.
The distance between bands also influences stop-loss placement and position sizing. Wider bands require either larger stops or smaller position sizes to maintain consistent risk levels.
Stop-Loss Placement Techniques
Stop-loss placement for Bollinger Band strategies varies based on the specific approach used. Squeeze traders often use stops beyond the opposite band, while band walk traders typically use the middle band as their risk level.
Dynamic stop adjustment based on band movement can help optimize trade management. As trends develop and bands expand, trailing stops can be adjusted to lock in profits while allowing room for continued momentum.
Automated Trading with Bollinger Bands
Modern trading platforms enable automation of Bollinger Band strategies through algorithmic trading systems. TradersPost facilitates the connection between trading signals and broker execution, allowing traders to implement systematic Bollinger Band approaches.
Automated systems can monitor multiple timeframes and instruments simultaneously, identifying squeeze conditions and breakouts across entire portfolios. This capability proves particularly valuable for traders managing numerous positions or monitoring extensive watchlists.
System Development Considerations
Developing automated Bollinger Band systems requires careful backtesting and parameter optimization. Different market conditions may favor different settings, requiring adaptive approaches or multiple system variations.
Risk management becomes even more critical in automated systems. Programming appropriate position sizing, stop-loss levels, and profit-taking rules ensures that automated strategies remain within acceptable risk parameters.
Market Context and Bollinger Band Effectiveness
Bollinger Band effectiveness varies across different market conditions and asset classes. Trending markets often favor band walk strategies, while range-bound markets may be better suited for reversal approaches.
Understanding broader market context helps traders select the most appropriate Bollinger Band strategy for current conditions. During high-volatility periods, wider band settings might prove more effective, while low-volatility environments may benefit from tighter parameters.
Asset Class Considerations
Different asset classes exhibit varying volatility characteristics that affect Bollinger Band performance. Forex markets, with their 24-hour nature and high liquidity, often show clear band patterns. Stock markets may experience different band behaviors during earnings seasons or major announcements.
Cryptocurrency markets, known for extreme volatility, might require adjusted band parameters or additional confirmation indicators. Commodity markets often show seasonal patterns that can enhance Bollinger Band signal interpretation.
Common Mistakes in Bollinger Band Trading
Many traders make predictable errors when implementing Bollinger Band strategies. Understanding these common mistakes helps improve trading performance and avoid costly errors.
One frequent mistake involves assuming that band touches automatically signal reversals. While prices often reverse near the bands, strong trends can maintain momentum along the bands for extended periods.
Signal Interpretation Errors
Misinterpreting band signals often leads to poor trading decisions. Traders sometimes enter reversal trades during strong trends or miss continuation opportunities during band walks. Proper signal interpretation requires considering broader market context and supporting indicators.
Another common error involves using fixed profit targets without considering band dynamics. Successful Bollinger Band trading often requires flexible profit-taking based on ongoing band behavior and market conditions.
Parameter Optimization Pitfalls
Over-optimization of Bollinger Band parameters represents another common mistake. While adjusting settings for specific market conditions can improve performance, excessive optimization often leads to curve-fitted systems that fail in real trading.
The standard 20-period, 2-standard deviation settings work well in most situations. Traders should have compelling reasons for deviating from these defaults and should thoroughly test any parameter changes across various market conditions.
Conclusion
Bollinger Bands trading strategies offer versatile approaches for various market conditions and trading styles. From squeeze plays that capitalize on volatility expansion to band walks that ride trending momentum, these strategies provide numerous opportunities for profitable trading.
Success with Bollinger Bands requires understanding the indicator's construction, recognizing key patterns, and implementing appropriate risk management. Combining band analysis with other technical tools often enhances signal quality and trading accuracy.
The dynamic nature of Bollinger Bands makes them particularly well-suited for modern markets characterized by changing volatility and diverse trading opportunities. Whether trading manually or through automated systems, these strategies can form a valuable component of a comprehensive trading approach.
As markets continue evolving, Bollinger Bands remain relevant due to their fundamental focus on volatility and price relationships. Traders who master these strategies position themselves to capitalize on the ongoing opportunities that volatility expansion and contraction provide across all market conditions.