New Indicator: Automatic Fibonacci Retracement
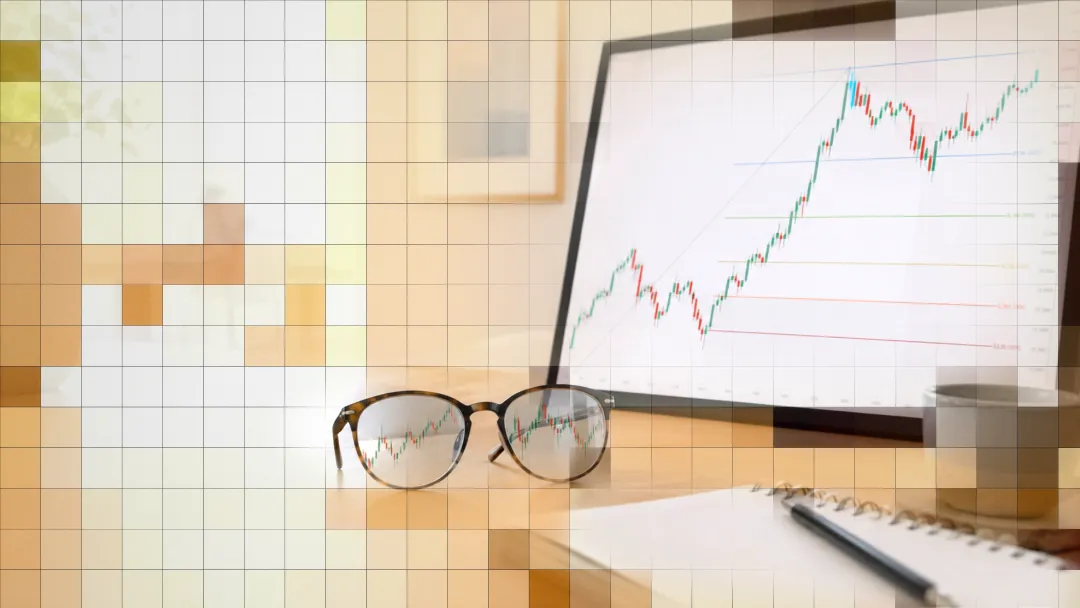
We've introduced the Automatic Fibonacci Retracement indicator to the TradersPost library, offering dynamic range adjustments and familiar functionality akin to TradingView's native tool. Enhanced with global alerts for all levels, this tool simplifies Fibonacci retracement analysis. Your feedback is vital for its continuous improvement.

Marketing

We're excited to introduce a new addition to the TradersPost library: the Automatic Fibonacci Retracement indicator. This tool represents our ongoing commitment to equip you with innovative and practical strategies.


Beyond the Ordinary Fibonacci Tools
While TradingView already offers a native Fibonacci retracement tool, and the community library presents several intriguing alternatives, our focus was on addressing specific challenges that traders face.
Addressing the Dynamic Range Challenge
Manually adjusting Fibonacci ranges can be a cumbersome process, especially when dealing with multiple ranges on a chart. With our new tool, you can effortlessly navigate through changing market conditions. For instance, what was yesterday's high might no longer hold significance today, and the 61.8% level of yesterday could become today's 38.2%. Our tool allows for dynamic adjustments, enabling you to analyze how ranges and levels evolve during the trading day.
Familiarity and Functionality
While exploring various alternatives, we noticed that many add unique features or analytics. Our goal was to develop a tool that retains the familiar features of the native Fibonacci tool, ensuring ease of use and compatibility. This approach allows for an intuitive experience and the flexibility to use our tool alongside the native one when needed.
Introducing Global Alerts for Every Level
We've enhanced our indicator with the alert() function. This means you can set a single alert in the Alerts Panel and receive notifications whenever any Fibonacci level is crossed, regardless of its current position.
Open to Feedback and Improvements
The true value of this indicator will be determined by its utility to the trading community. We welcome your feedback and are committed to making improvements based on your experiences and suggestions. If you find value in this tool and have ideas for enhancement, please share your thoughts with us.