
What Is Overfitting in Trading? How to Detect and Avoid It
Overfitting is like walking an unfamiliar path blindfolded, convinced you know every twist and turn, only to fall flat on your face in the first 20 feet.

Co-Founder / CSO
Reviewed by Tom Hartman
Fact-checked by Tom Hartman

The more confident you are, the harder you fall.
You've walked the left path a thousand times. You know every bend, every twist, and every elevation change. Despite all that experience and repetition, nothing could have prepared you for a brand new trail on the right.
This is a bit like trading live capital with an automated trading strategy that you're unaware is overfit. Let's cover what overfitting is, how to purposefully experience it, and how to measure and reduce the likelihood.
What does overfitting look like?
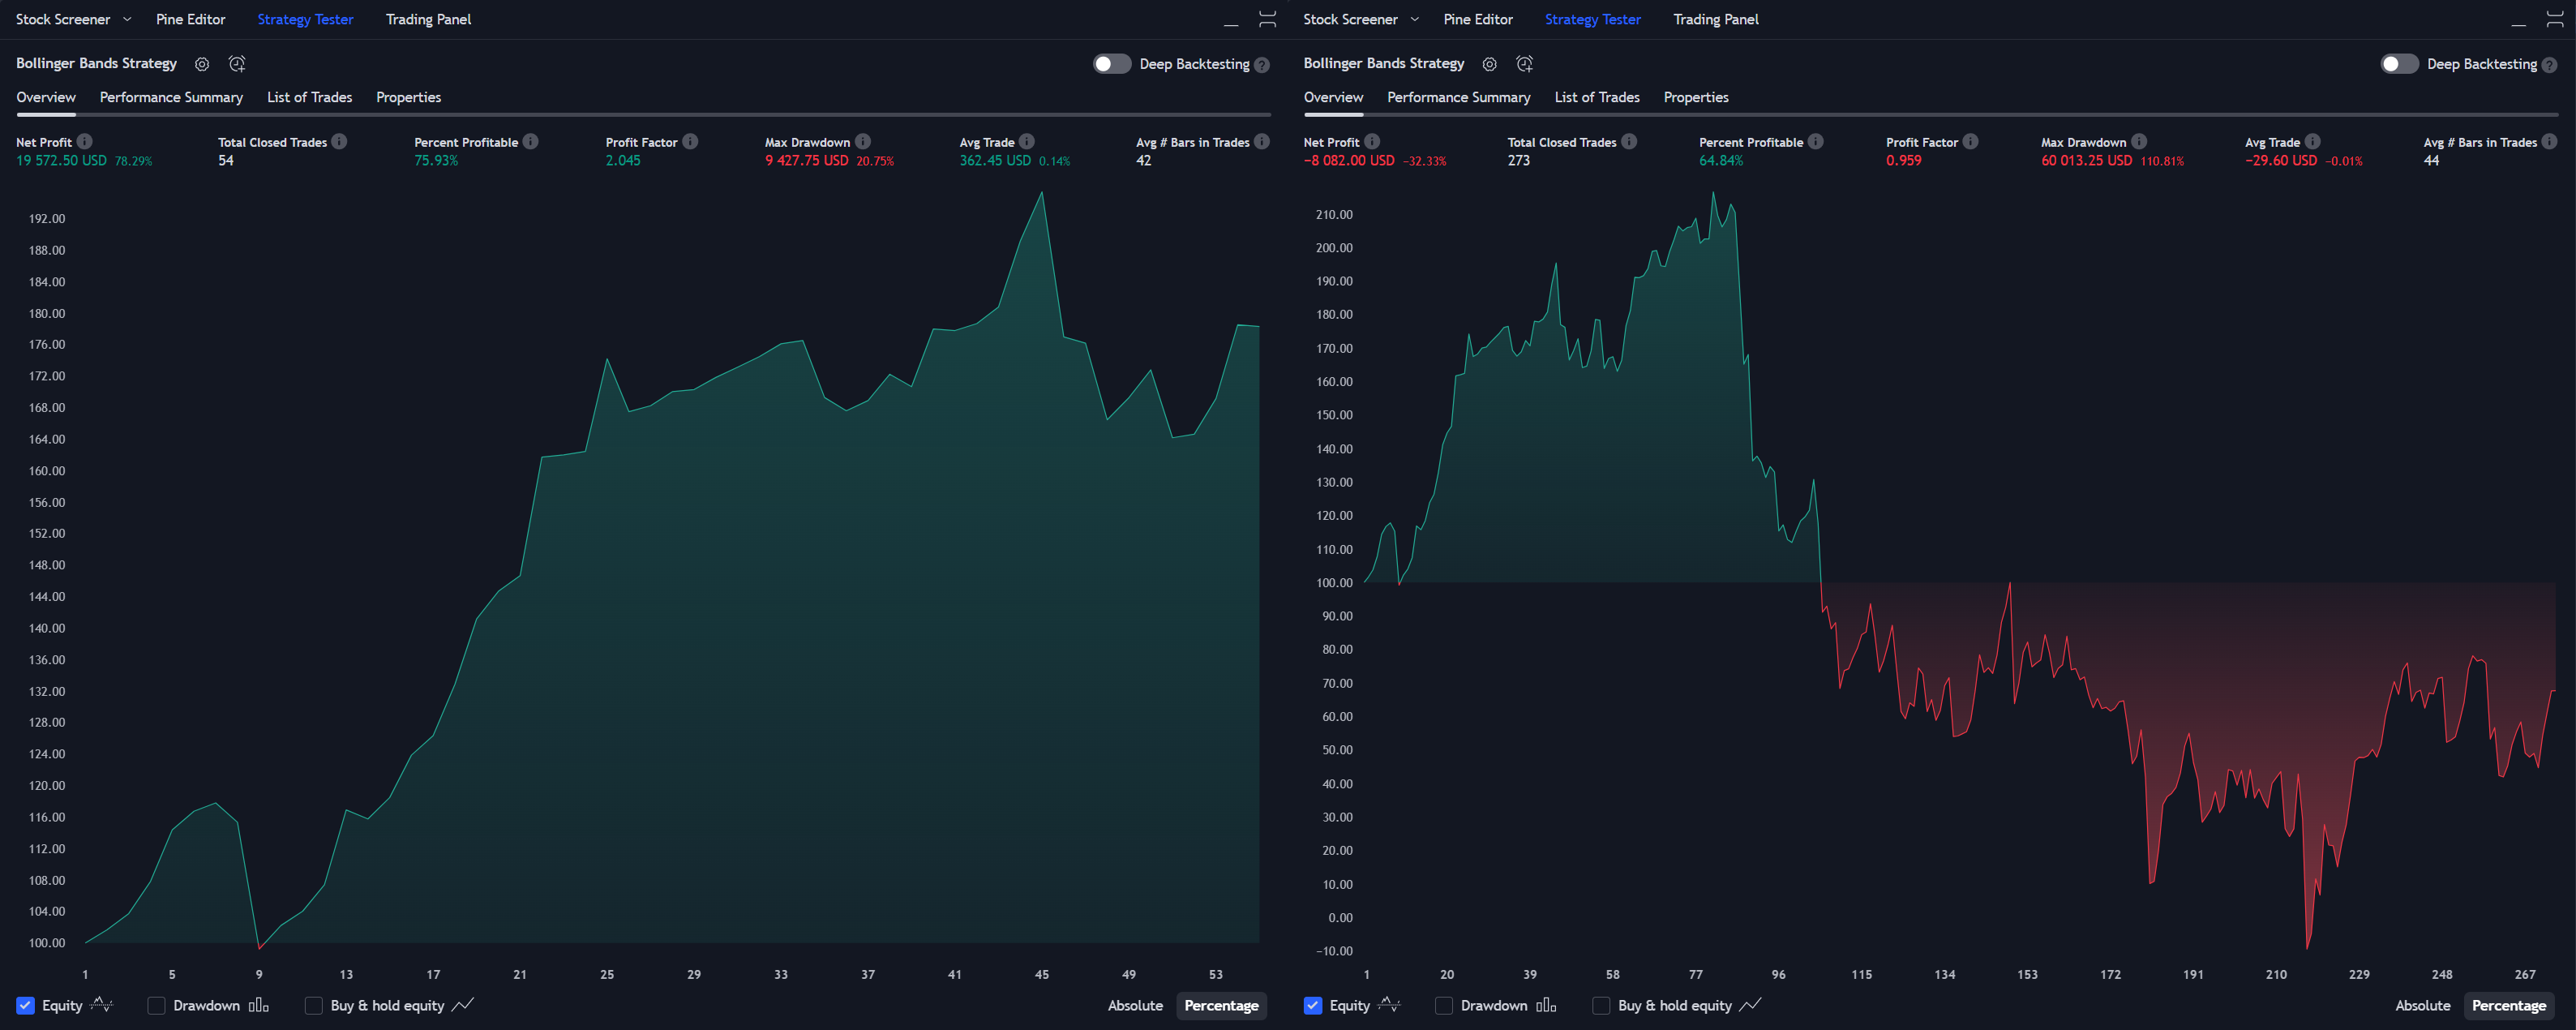
Overfitting typically shows up when you go to run your strategy with live capital or do a walk-forward test and over several trades it simply doesn't hold up to the performance your back test promised. You expected the equity curve on the left and ended up with the curve on the right:
What is overfitting?
In more technical terms, overfitting occurs when a trading strategy is excessively tuned to historical data, capturing not just the underlying market signals but also the noise (random fluctuations and anomalies that do not represent true market patterns). This is akin to memorizing every step and turn of your familiar path, including all the little boulders and obstacles along the way, and expecting those same conditions to apply when the path changes.
In the realm of trading strategy development, overfitting happens through the creation of strategies that perform exceptionally well on the data they were trained on, due to their complex rules or parameters that are specifically optimized for that dataset. However, these strategies often fail to generalize to new, unseen data because the conditions they were optimized for do not precisely recur.
Overfitting on Purpose
It's helpful to start with how to purposefully create an overfit strategy. There are several methods that might help you understand how it occurs:
- Test an abundance of parameters. Test every setting possible to "dial in" the perfect back test. Use a chrome extension like TradingView Strategy Finder to test every input parameter possible until you get the result you want. In doing this, we'll also ignore the statistical likelihood that at least one strategy will perform well by chance.
- Use the same window of time for training and testing. Use the entire available history of data to run your back test on leaving no additional data to run a final test on.
- Make the strategy as complex as possible. Purposefully ignoring the bias-variance trade-off is a surefire way to overfit a model. This involves creating a model so complex that it captures not just the true underlying patterns (bias) but also the random noise in the data (variance). Read more on the bias-variance trade-off below.
- Cherry pick the results. Choose only the periods of time that lead to the best back test results, ignoring the windows of time where the strategy doesn't hold up.
Strategies for Avoiding Overfitting
With the right approach, it is possible to mitigate the risk of overfitting and develop strategies that stand the test of time. By focusing on developing a solid hypothesis, being selective with data, and embracing simplicity over complexity, traders can create strategies that are both effective and adaptable.
Develop a Hypothesis

A strong hypothesis takes into consideration the asset and market you're trading, the behavior of market participants, how they react to price movements, and the impact of external events. Start by asking key questions: Who are the major players in this market? What motivates their decisions? How might they respond to sudden price changes, economic announcements, or geopolitical events? This initial analysis should be informed by both quantitative data and qualitative understanding of market dynamics. Crafting a hypothesis requires a blend of market knowledge, historical analysis, and a keen observation of current trends. By grounding your strategy in a well-thought-out hypothesis, you reduce the risk of overfitting to noise and increase the likelihood of capturing true market drivers.
Next, if your strategy relies on technical indicators, ensure that the indicators you choose don't repaint, are simple in nature, and aren't designed to only apply with very strict rules. A strong signal should appear without a vast number of rules.
Data Selection Process
The data selection process is critical in developing a strategy that is robust and resistant to overfitting. It involves determining which data are relevant to your trading hypothesis and which are not. Start by including data that directly relates to your hypothesis, such as price data, volume, and perhaps sentiment indicators if your hypothesis involves market sentiment. It's also important to consider the time frame of the data; for example, if your strategy is based on day trading, years of historical data may be less relevant than the most recent months or weeks. Conversely, exclude data that does not contribute to your hypothesis or could introduce noise. This might include ignoring data from markets or assets that have little correlation with the one you're trading or excluding outlier events that are unlikely to repeat. The goal is to focus on data that enhances your understanding of the market dynamics relevant to your hypothesis without cluttering your analysis with irrelevant information.
Simplification vs Complexity
When it comes to developing trading strategies, simplicity often trumps complexity. A simple strategy is not only easier to understand and implement but is also less likely to be overfitted to past data. Start by focusing on a few key indicators or signals that are directly tied to your hypothesis. Resist the temptation to add more and more parameters or conditions in an effort to capture every possible market scenario. Remember, each additional parameter increases the risk of overfitting your strategy to historical data, making it less adaptable to future conditions. Moreover, a simple strategy is more transparent and easier to evaluate and adjust as market conditions change. By keeping your strategy straightforward, you ensure it is grounded in fundamental market principles, making it more likely to be resilient over time.
Consider the Bias-Variance Trade-Off
The bias-variance trade-off in trading strategy development is like balancing the simplicity and complexity of your strategy. If your strategy is too simple (high bias), it might not catch all the opportunities in the market because it overlooks some important patterns. On the other hand, if your strategy is too complex (high variance), it might start to "see" patterns where there are none, reacting to random market noise instead of genuine trends. This can lead to a strategy that works well on past data but fails in real trading. The goal is to find a middle ground where your strategy is sophisticated enough to identify real market opportunities without getting tricked by random fluctuations.
Metrics to Pay Attention To
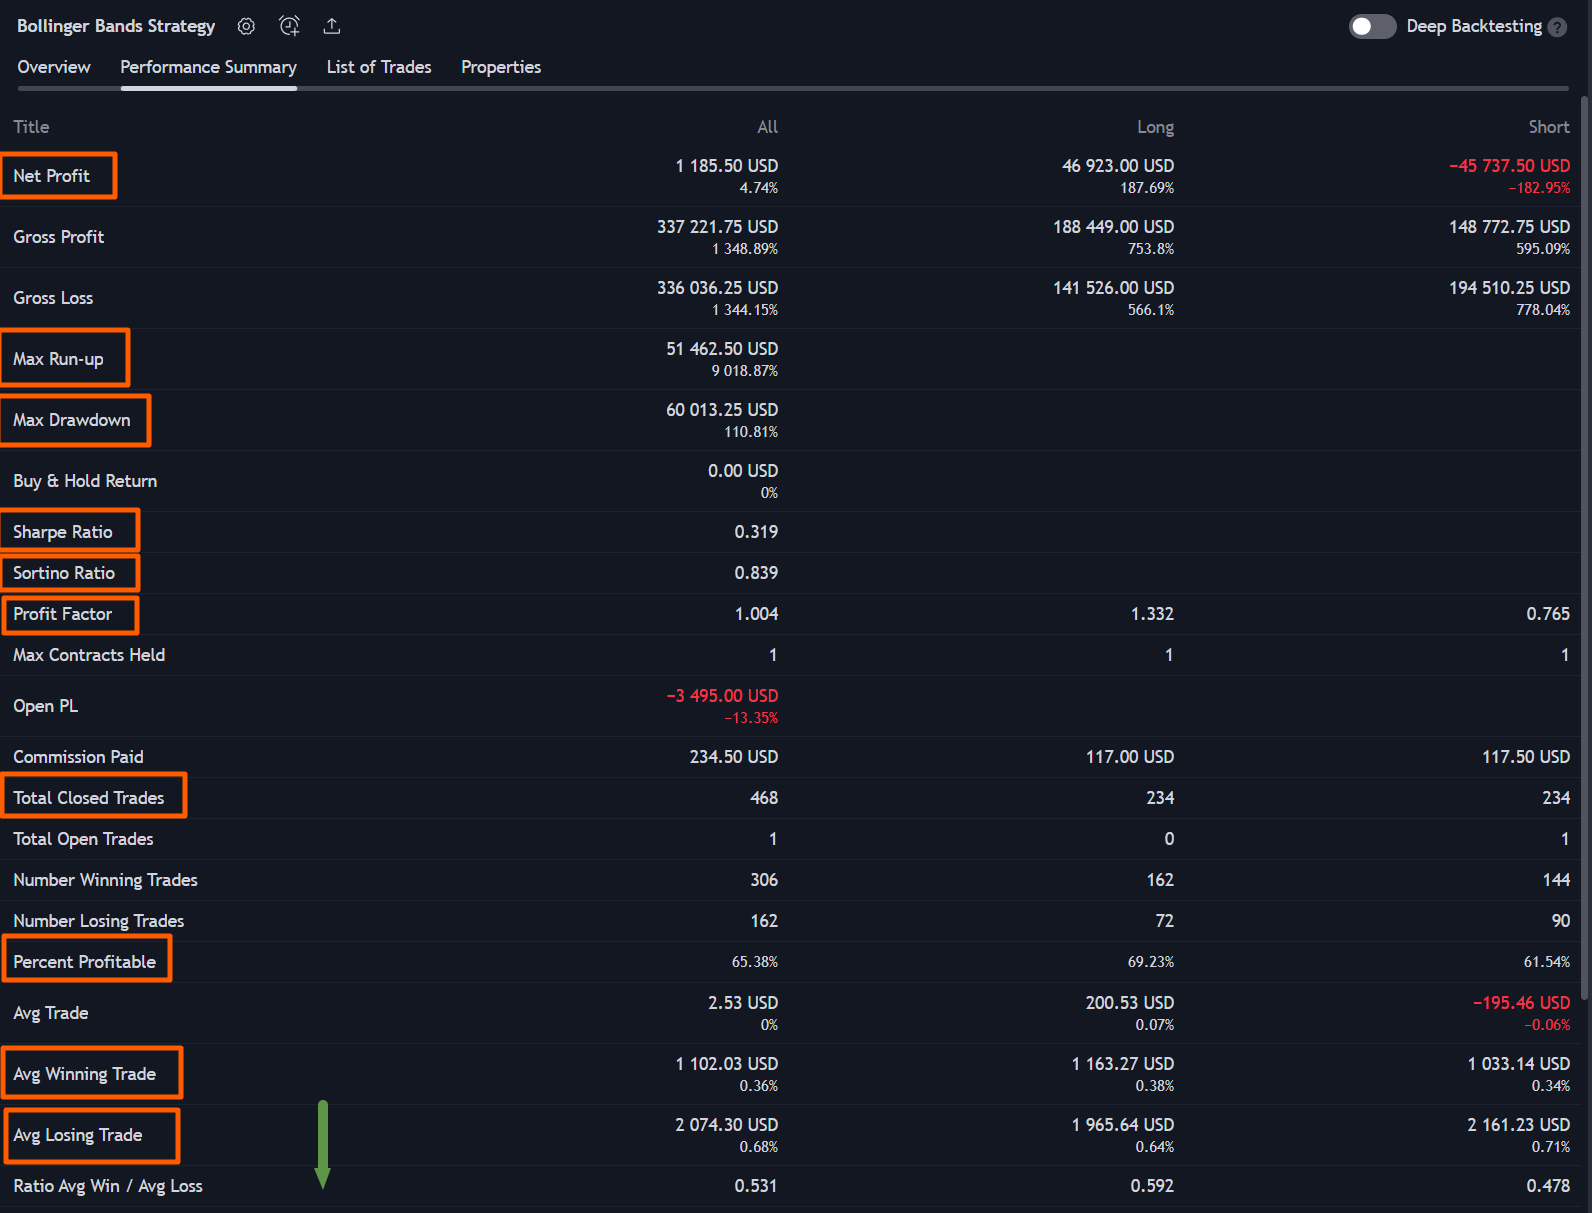
TradingView’s backtesting tool provides a comprehensive set of metrics that traders can use to evaluate the performance of their strategies. Go beyond the Net Profit on the Overview and click the Performance Summary.
Understanding these metrics is crucial for interpreting the results of a backtest and assessing the potential for overfitting. Here's a breakdown of these metrics, what they indicate about a strategy's performance, and how they can help identify signs of overfitting.
Net Profit
- What It Is: The total profit generated by the strategy after subtracting losses from gains.
- Importance: A primary indicator of strategy success, but high net profit alone doesn’t guarantee a strategy's future performance, especially if it’s a result of overfitting.
Total Closed Trades
- What It Is: The number of trades that were opened and then closed by the strategy.
- Importance: Provides insight into the strategy's activity level. A high number of trades with consistent profit suggests robustness, but a strategy could be overfit if it only performs well in a specific market condition.
Percent Profitable
- What It Is: The percentage of trades that were profitable.
- Importance: High profitability is desirable, but an unusually high percentage might indicate overfitting to historical data.
Profit Factor
- What It Is: The ratio of total gross profits to total gross losses.
- Importance: A profit factor greater than 1 indicates a profitable strategy. However, an extremely high profit factor requires scrutiny for potential overfitting. Many profitable strategies end up with profit factors of 1.5 - 2.
Max Drawdown
- What It Is: The largest peak-to-trough decline in the strategy’s equity curve.
- Importance: Offers insight into the risk and volatility of the strategy. A strategy with minimal drawdown might be overfit to historical periods of low volatility.
Avg Trade
- What It Is: The average profit or loss per trade.
- Importance: Helps assess the consistency of trade outcomes. A high average trade value skewed by a few large wins might suggest overfitting.
Avg # Bars in Trades
- What It Is: The average duration of trades in terms of price bars.
- Importance: Longer durations might indicate a trend-following strategy, while short durations suggest a scalping strategy. Anomalies in expected durations could signal overfitting.
Max Run-up
- What It Is: The maximum unrealized profit observed in a trade before it's closed.
- Importance: High max run-up can indicate potential in a strategy, but if significantly higher than most profits realized, it may suggest overfitting to ideal exit points.
Sharpe Ratio
- What It Is: A measure of risk-adjusted return which is a measure of the profit a strategy generates in relation to the level of risk it incurs. It typically also includes a discount of the risk-free rate of return in the calculation. TradingView defaults this to 2% annually which is not currently accurate, and worth noting. It can be changed with the "risk_free_rate" parameter of the "strategy()" function).
- Importance: A higher Sharpe ratio indicates a more efficient strategy. However, an excessively high ratio could be a sign of overfitting to a specific market phase. Below 1 is suboptimal, 1-2 is good, 2-3 is very good, and above 3 is excellent, but is rare and could be a hint of overfitting.
Sortino Ratio
- What It Is: Similar to the Sharpe ratio but only considers downside volatility.
- Importance: A high Sortino ratio is favorable, indicating good returns for the risk taken. Be wary of ratios that seem too good to be true, as they may indicate overfitting. Below 1 is poor, 1-2 is acceptable, 2-3 is good, 3 and above is excellent.
Avg Trade % Return
- What It Is: The average percentage return per trade.
- Importance: Gives a relative measure of profitability irrespective of trade size. Extremely high values may need investigation for overfitting.
Avg Winning Trade
- What It Is: The average profit of winning trades.
- Importance: Helps to understand the payoff profile. A strategy may be overfit if a few wins are significantly higher than the average.
Avg Losing Trade
- What It Is: The average loss of losing trades.
- Importance: Important for assessing risk management. An overfitted strategy might show minimal average losses if tailored to avoid losses in historical testing.
Ratio Avg Win / Avg Loss
- What It Is: The average size of wins compared to the average size of losses.
- Importance: A high ratio is generally positive but scrutinize unusually high ratios for potential overfitting.
Identifying Outliers
An essential part of analyzing backtest results is looking for outliers. If the largest winning trade is significantly greater than the average trade, this could indicate that the strategy’s net profit is heavily reliant on a few outlier trades rather than consistent performance across many trades. Such a strategy might perform well in backtesting but could be unreliable in real-world trading conditions, suggesting overfitting to specific historical anomalies rather than capturing a replicable, market-wide edge.
Understanding and critically evaluating these metrics in the context of your trading strategy can help you spot potential overfitting and refine your approach for better real-world applicability and robustness.
Verifying Strategy Performance with TradersPost and a Walk-Forward Test
TradersPost offers a seamless solution for traders looking to validate the performance of their TradingView strategies in a simulated, risk-free environment. By enabling the execution of paper trading trades directly from TradingView strategies, TradersPost provides an invaluable tool for testing whether a strategy repaints, assessing the impact of timing and slippage on trade execution, and confirming that these critical factors are accurately accounted for in the strategy's design. This real-time testing environment mirrors live market conditions, allowing traders to gain a comprehensive understanding of how their strategies would perform without risking actual capital.
Furthermore, TradersPost facilitates an extended walk-forward testing period, which is crucial for verifying the robustness of a backtest against unseen data. By applying your TradingView strategy over a substantial timeframe beyond the historical data used in backtesting, TradersPost helps ensure that your strategy is not only well-tuned to past market conditions but is also capable of adapting to future market dynamics. This practical approach to strategy verification underscores the importance of real-world testing in developing a trading approach that is both resilient and adaptable, providing a stronger foundation for achieving consistent trading success.