MNQ Point Value Per Contract Explained
MNQ point value per contract is $2 per index point and $0.50 per tick. See the math, worked examples, and how it compares to NQ.

Marketing

The MNQ point value per contract is $2 for each Nasdaq-100 index point. MNQ moves in minimum increments of 0.25 point, so one tick is worth $0.50 per contract. Four ticks equal one full point and $2 of profit or loss per contract.1
To convert an MNQ price move into dollars, multiply the number of points moved by $2, then multiply by the number of contracts. That simple calculation supports position sizing, stop placement, bracket-order planning, and comparisons between MNQ and the larger NQ contract.
MNQ Point Value at a Glance
Core MNQ Contract Specifications
MNQ is the Micro E-mini Nasdaq-100 futures contract. Its contract multiplier is $2 times the Nasdaq-100 index, which makes each full index point worth $2 per contract. The minimum outright price movement is 0.25 point, worth $0.50 per contract.2
- Point value: $2 per index point per contract
- Tick size: 0.25 index point
- Tick value: $0.50 per contract
- Ticks per point: four
- Settlement: cash-settled
- Underlying reference: Nasdaq-100 index
MNQ references the same Nasdaq-100 index as NQ, but it is a separate, dated futures agreement. It does not represent ownership of the index or shares in its component companies.
Notional Value Versus Margin
Notional value measures the total market exposure represented by one contract. Calculate it by multiplying the current index level by the $2 MNQ multiplier. At an index level of 25,000, one MNQ contract has approximately $50,000 of notional exposure. Near an index level of 29,557, that rises to approximately $59,100.3
Margin is different. It is the deposit required to establish or maintain the leveraged position, not the contract's total value. Published reference figures have placed MNQ initial margin at approximately $2,100, while another broker reference quotes roughly $2,200-$2,600 per contract. Actual requirements vary with volatility and broker policy.4
A trader controlling $50,000 of notional exposure is not paying $50,000 for the contract. However, profit and loss still respond to the full $2-per-point contract multiplier. A reduced margin requirement does not reduce the dollar value of a market move.
How the $2 Multiplier Works
What Point Value Means
MNQ's contract unit is defined as $2 times the Nasdaq-100 index. If the futures price moves from 20,000 to 20,001, one long contract gains $2 before commissions and fees. A short contract loses $2 from the same upward move.
The multiplier is a fixed contract term. It is not determined by account equity, buying power, margin requirements, or the amount deposited with a broker. Those account figures affect whether a position can be opened and maintained, but they do not change what one MNQ point is worth.5
Turning Chart Moves Into Dollars
Use this calculation for any MNQ move:
Dollar move = points moved x $2 x contracts
For one contract, a 10-point move equals $20. For five contracts, the same 10-point move equals $100. The chart movement is unchanged, but the position's dollar exposure increases with contract quantity.6
This distinction matters when scaling an automated strategy. Signal logic can remain identical while quantity changes the dollar outcome. Test the full calculation for entries, stops, profit targets, and maximum adverse moves before changing contract count.
Tick Size and Tick Value Explained
The 0.25-Point Tick
The minimum outright price increment for MNQ is 0.25 index point. Multiplying 0.25 by the $2 point value produces a tick value of $0.50 per contract. Four ticks make one point:
4 ticks x $0.50 = $2.00
A move from 18,000.00 to 18,000.25 is one tick. A move from 18,000.00 to 18,001.00 is four ticks. With three contracts, each tick changes the position value by $1.50, and each full point changes it by $6.7
Outright Ticks Versus Spread Increments
An outright MNQ position uses the standard 0.25-point minimum increment. A qualifying MNQ intermonth spread has a separate minimum increment of 0.05 point, worth $0.10 per spread.8
The spread increment does not replace the standard outright tick. Seeing two delivery months on an order screen is not enough to conclude that the spread increment applies. Confirm whether the order is an exchange-recognized intermonth spread or two separate outright legs.
MNQ Point Value Compared to NQ
Side-by-Side Dollar Values
MNQ and NQ reference the same Nasdaq-100 index, but their multipliers differ by a factor of ten. MNQ is worth $2 per point and $0.50 per tick. NQ is worth $20 per point and $5 per tick.9
- MNQ one-point move: $2 per contract
- NQ one-point move: $20 per contract
- MNQ 0.25-point tick: $0.50 per contract
- NQ 0.25-point tick: $5 per contract
- MNQ dollar scale: one-tenth of NQ
Both contracts are cash-settled to the Nasdaq-100 Special Opening Quotation. Their index reference and price action are closely aligned, but the dollar result for a given move is ten times larger with NQ.10
The Sizing Mistake to Avoid
Because MNQ and NQ produce nearly identical charts, it is easy to calculate risk using one multiplier and submit an order for the other symbol. Switching from one MNQ contract to one NQ contract increases the dollar value of every point and tick by ten times.
Always verify the root symbol, contract month, year, and quantity before submission. This check is especially important when copying an alert, changing a chart symbol, rolling a strategy, or reusing an order template.
Calculating P&L From Point Value
The Basic P&L Formula
For a long MNQ trade, subtract the entry price from the exit price. For a short trade, subtract the exit price from the entry price. Then apply the multiplier and quantity:
Dollar P&L = points moved x $2 x contracts
To express the same move in ticks, divide the point movement by 0.25. A five-point move contains 20 ticks. Direction determines the sign: rising prices benefit a long position and hurt a short position, while falling prices do the opposite.11
Worked Example: Simple Long Trade
Assume a trader buys one MNQ contract at 18,000.00 and sells it at 18,005.00. The favorable move is five points.
- Calculate points: 18,005.00 minus 18,000.00 equals 5 points
- Calculate dollars: 5 x $2 x 1 contract equals $10
- Check with ticks: 5 divided by 0.25 equals 20 ticks
- Convert ticks: 20 x $0.50 equals $10
The gross profit is $10. This example excludes commissions and fees, so the net account result would be lower.12
Worked Example: Bracketed Short Trade
Assume a trader sells two MNQ contracts at 17,500.00, places a take-profit order at 17,492.00, and places a stop-loss order at 17,504.00.
The profit target is eight points below entry. For a two-contract short position, the potential gross gain is:
8 points x $2 x 2 contracts = $32
The stop is four points above entry. The defined gross loss is:
4 points x $2 x 2 contracts = $16
These outcomes assume fills at the specified prices and exclude commissions and fees.13
Contract Mechanics That Affect Value
Cash Settlement, Not Delivery
MNQ is cash-settled to the Nasdaq-100 Special Opening Quotation on the third Friday of the contract month. Settlement does not involve delivery of Nasdaq-100 component shares. Traders commonly close or roll positions before final settlement.14
Cash settlement does not alter the regular $2 point value. It changes how an expiring contract is resolved. Traders holding positions near expiration should confirm the relevant contract calendar and their broker's deadlines rather than assuming the position will roll automatically.
Quarterly Months and Symbols
MNQ uses quarterly contract months: March uses H, June uses M, September uses U, and December uses Z.15 A complete trading symbol identifies a particular month and year, while a continuous symbol represents a platform-generated historical or front-month series.
Continuous symbols such as MNQ1! can be mapped according to rollover schedules that differ between platforms. TradersPost recommends using an explicit futures contract symbol, such as MNQU2025, rather than relying on continuous-symbol mapping. Hardcoding the intended contract removes ambiguity about which delivery month an alert should trade.
Nearly 24-Hour Trading Hours
MNQ trades on CME Globex from Sunday evening through Friday afternoon, with a daily maintenance break. One published schedule lists trading from 5:00 p.m. to 4:00 p.m. the following day in Central Time, with a break from 4:00 p.m. to 5:00 p.m.16
The contract multiplier applies equally during regular, overnight, and pre-market sessions. A 20-point overnight move is still worth $40 per contract. Positions can therefore change value during news events or other periods when a trader is not monitoring the market.
Using Point Value for Risk Sizing
Sizing Contracts to Dollar Risk
Start with a maximum dollar risk and a technically determined stop distance. Risk per contract equals the stop distance in points multiplied by $2. Divide the risk budget by that result and round down to a whole contract:
Contracts = dollar risk budget / (stop points x $2)
For example, a $100 risk budget with a 25-point stop allows two MNQ contracts. Each contract carries $50 of risk because 25 points multiplied by $2 equals $50. Two contracts reach the $100 limit.17
If the result is 2.6 contracts, rounding down to two keeps the planned risk below the limit. Rounding up to three would create $150 of risk with the same 25-point stop. This calculation should occur before the order is submitted.
Setting Bracket Orders in Points
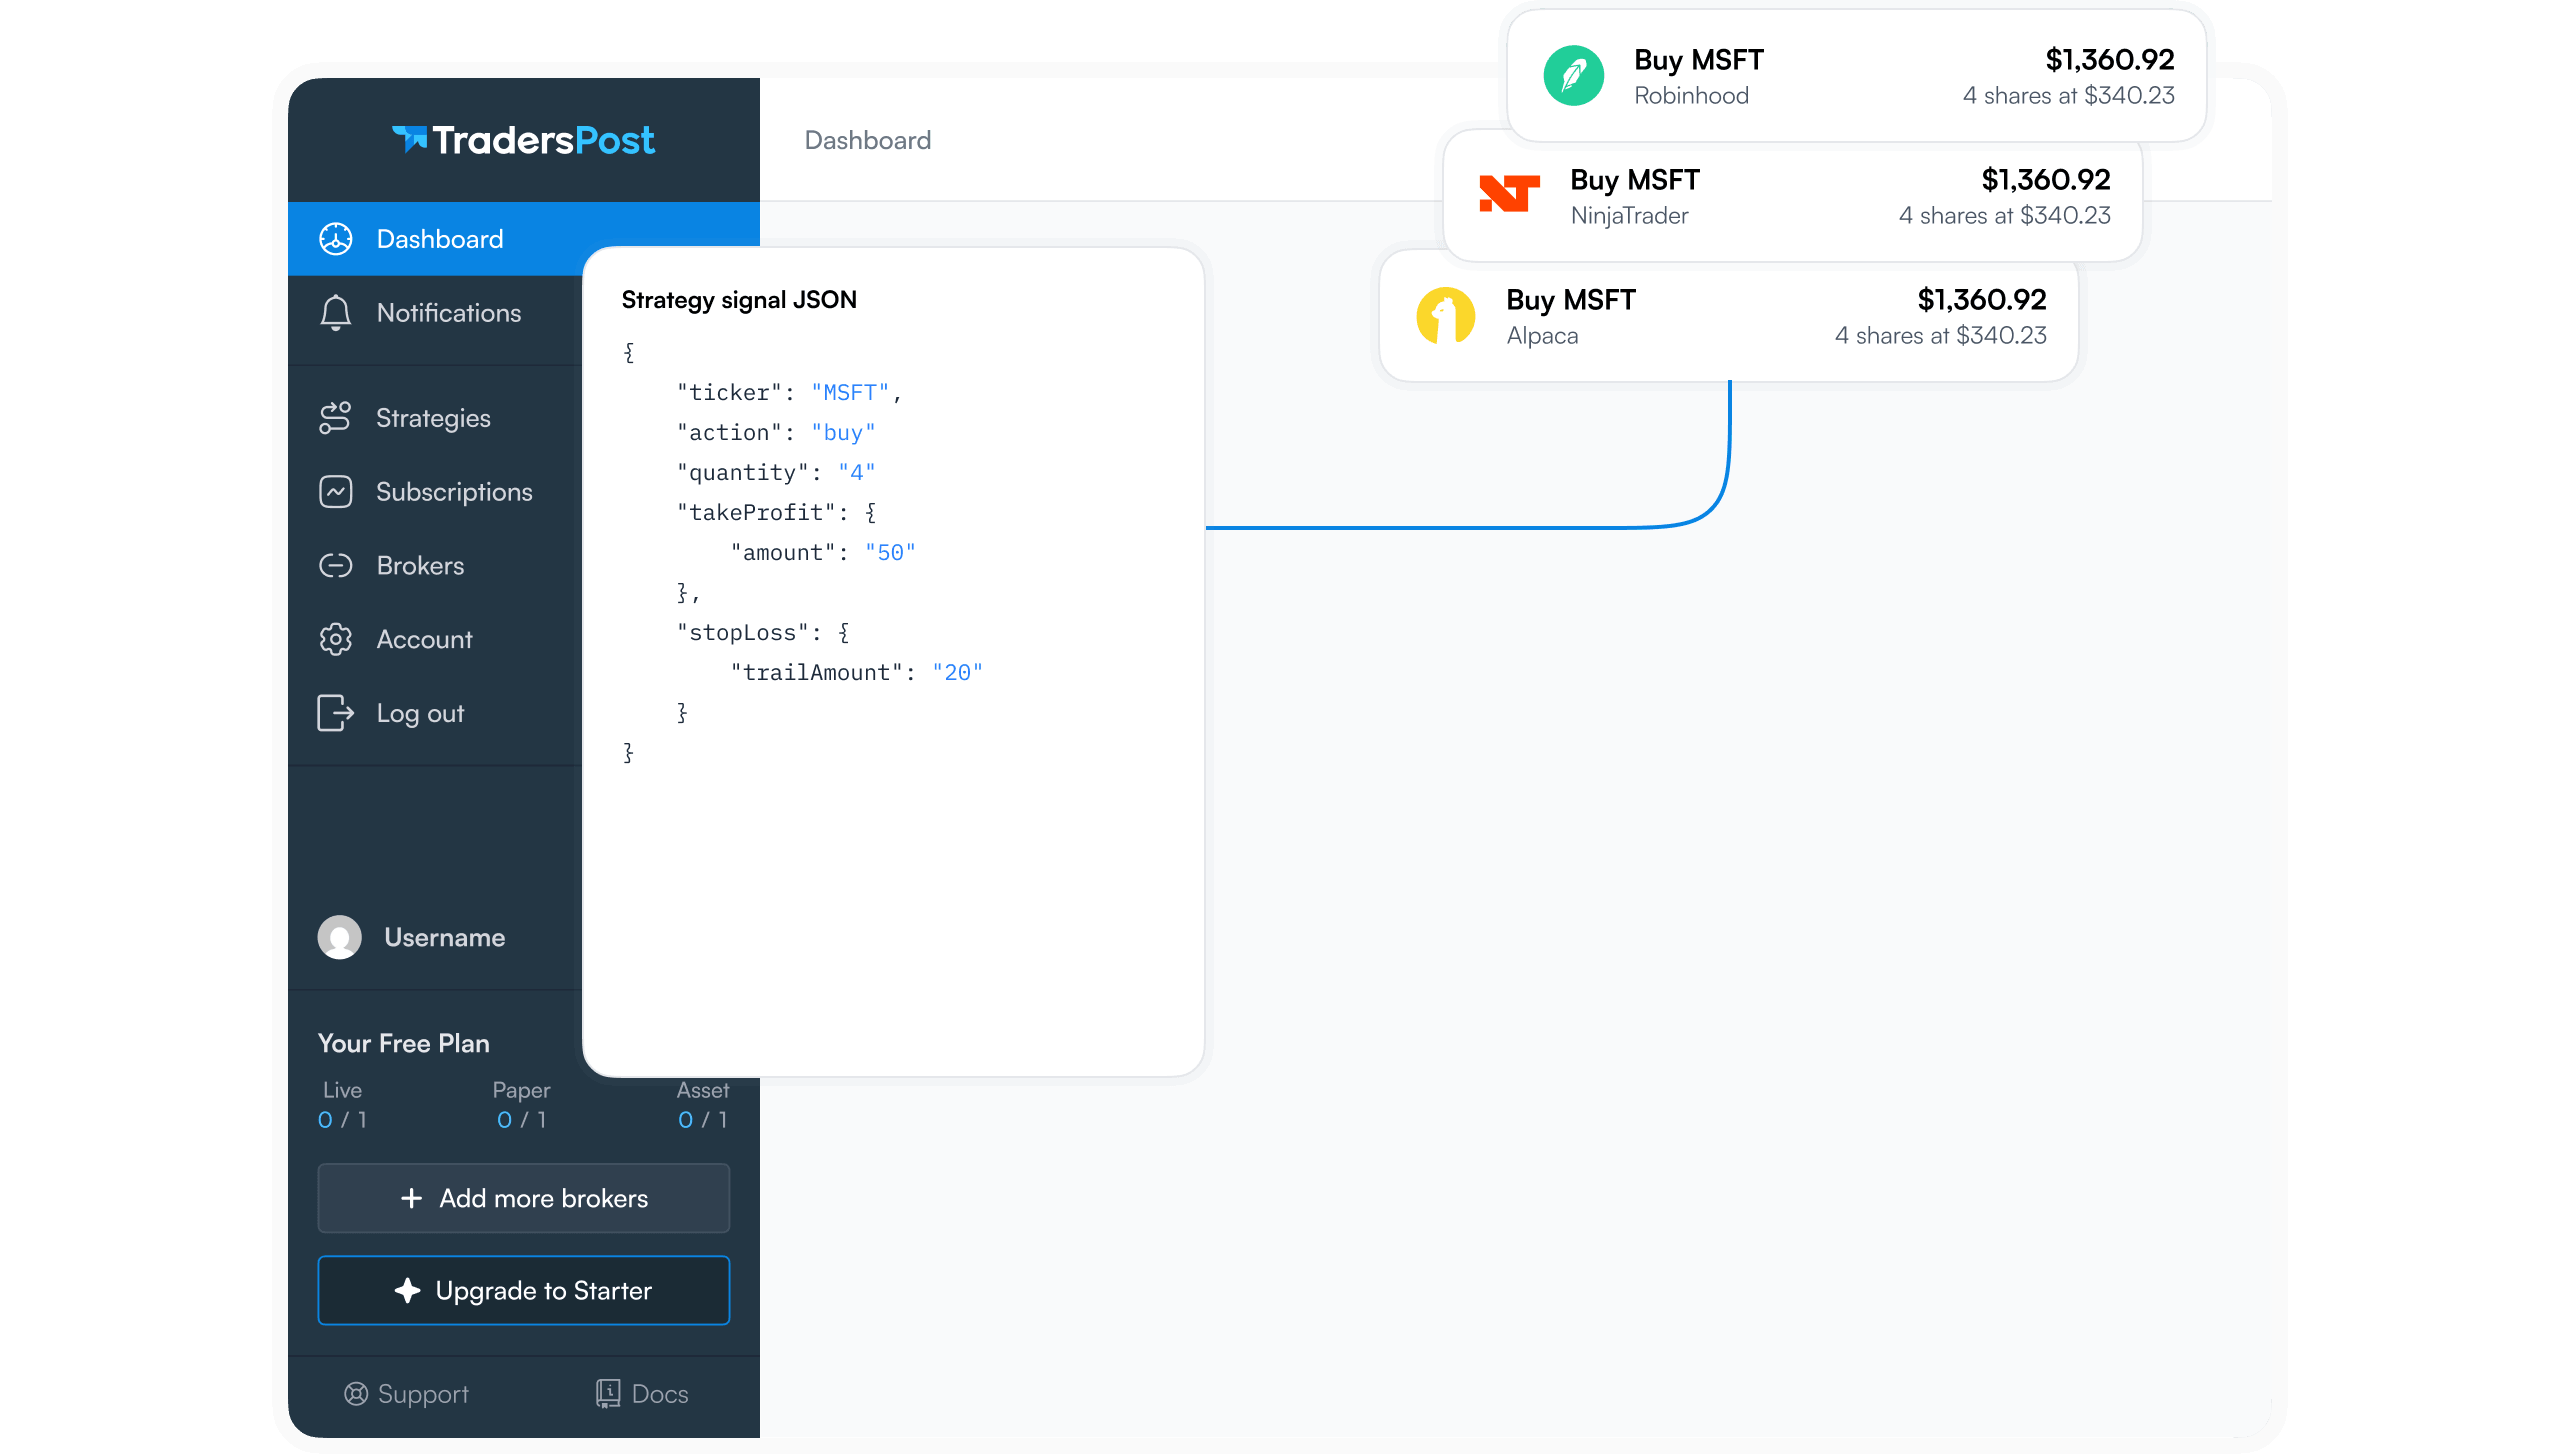
For futures in TradersPost, take-profit and stop-loss amounts are calculated as market price offsets from the entry price. They are not entered as dollar P&L targets. If MNQ entry is 25,125.25 and both offsets are 100, the take-profit level is 25,225.25 and the stop-loss level is 25,025.25.
A 100-point offset on one MNQ contract represents $200 before fees. On three contracts, it represents $600. The price offset remains 100 points, while the actual dollar outcome changes with the $2 point value and the number of contracts.
Before going live, test MNQ bracket-order sizing with a paper trading account. Confirm the explicit contract symbol, entry quantity, price offsets, and expected dollars at risk. TradersPost includes a built-in paper broker that can be used for initial tests before connecting a live account.
Bottom Line
- One MNQ contract is worth $2 per index point.
- The 0.25-point outright tick is worth $0.50 per contract.
- Dollar P&L equals points moved multiplied by $2 and contract quantity.
- MNQ is one-tenth the dollar size of NQ.
- Notional exposure, margin, and point value measure different things.
Conclusion
The MNQ point value per contract gives traders a direct way to translate chart distance into dollar exposure. Use $2 per point or $0.50 per tick, then multiply by the number of contracts. Apply that math to both favorable targets and adverse stop distances before submitting an order.
The most important operational checks are simple: confirm MNQ rather than NQ, verify the exact contract month, distinguish outright orders from intermonth spreads, and calculate risk before changing quantity. Test the complete order workflow in a paper account so the symbol, bracket offsets, and expected dollar risk match before live deployment.
Frequently Asked Questions
What Is One MNQ Point Worth?
One MNQ contract is worth $2 per index point. A 10-point move changes the gross value of one contract by $20.
What Is an MNQ Tick Worth?
The minimum outright tick is 0.25 index point, worth $0.50 per contract. Four ticks make one full point and equal $2 per contract.
How Do I Calculate MNQ P&L?
Multiply the points moved by $2, then multiply by the number of contracts. A five-point move on one contract equals $10. For a short position, the result is negative when the price rises and positive when it falls.
Is MNQ the Nasdaq-100 Index?
No. MNQ is a dated, cash-settled futures contract that references the Nasdaq-100 index. It is not the index itself or an ownership interest in the underlying companies, and settlement does not deliver shares.
How Does MNQ Compare to NQ?
NQ is worth $20 per point and $5 per tick, exactly ten times MNQ's $2 point value and $0.50 tick value. Verify the exact symbol before sizing a trade to avoid unintended tenfold exposure.
References
1 MNQ Point Value: What One Move Is Worth in the Micro Nasdaq
2 MNQ Micro E-mini Nasdaq-100 Cheat Sheet
3 NQ Contract Specifications
4 Micro E-mini Nasdaq-100 Futures Contract Specifications
5 What Are Micro E-mini Nasdaq-100 Futures?
6 MNQ Point Value: What One Move Is Worth in the Micro Nasdaq
7 MNQ Micro E-mini Nasdaq-100 Cheat Sheet
8 What Are Micro E-mini Nasdaq-100 Futures?
9 MNQ Point Value: What One Move Is Worth in the Micro Nasdaq
10 Micro E-mini Nasdaq-100 Futures Contract Specifications
11 MNQ Micro E-mini Nasdaq-100 Cheat Sheet
12 MNQ Micro E-mini Nasdaq-100 Cheat Sheet
13 MNQ Micro E-mini Nasdaq-100 Cheat Sheet
14 What Are Micro E-mini Nasdaq-100 Futures?
15 MNQ Micro E-mini Nasdaq-100 Cheat Sheet
16 Micro E-mini Nasdaq-100 Futures Contract Specifications
17 MNQ Point Value: What One Move Is Worth in the Micro Nasdaq