High Implied Volatility Option Strategies
Learn which option strategies work best in high implied volatility, how IV affects premiums, and how to size and automate trades around IV rank.

Marketing

A high implied volatility option strategy usually focuses on selling expensive premium through covered calls, cash-secured puts, credit spreads, iron condors, or short strangles. The opportunity comes from collecting elevated extrinsic value and potentially benefiting if implied volatility falls, but the larger premium compensates for a genuinely wider range of possible outcomes.
The practical challenge is deciding whether IV is high for the specific underlying, selecting strikes that fit the expected range, and controlling exposure around scheduled events. IV rank, IV percentile, breakeven math, and regime-based position sizing provide a more consistent framework than relying on raw IV alone.
What High Implied Volatility Means
Implied Volatility and IV Rank
Implied volatility is the options market's forecast of the magnitude of an underlying asset's potential price movement, typically expressed as an annualized percentage. It describes expected movement size, not whether the next move will be higher or lower.1
IV is derived by working backward from option prices through a pricing model such as Black-Scholes. Unlike historical volatility, it does not come from past returns. Each option contract can have its own IV because its market price, strike, and expiration differ.
Two relative measures help determine whether current IV is elevated:
- IV rank = (current IV - 52-week IV low) / (52-week IV high - 52-week IV low).
- IV percentile = days with IV below the current reading / total days in the lookback period.
IV rank measures distance within the annual range. IV percentile counts how often volatility was lower. A single extreme spike can distort IV rank more than IV percentile.2
What Counts as High IV
There is no universal high-IV threshold. A diversified ETF generally carries lower IV than a single stock because company-specific moves are dampened across a basket. Technology stocks also tend to have higher baseline IV than defensive sectors such as utilities and consumer staples.
Use the underlying's rolling history instead of comparing raw readings across unrelated assets. As a working guideline, an IV percentile above roughly 70-75 is commonly treated as high. Strategy-specific thresholds can differ, with covered calls and vertical credit spreads becoming candidates near the 60th percentile and iron condors near the 70th percentile.3
Implied Versus Realized Volatility
Implied volatility is forward-looking, while realized volatility measures price movement that has already occurred. Historical evidence indicates that IV tends to overstate subsequent realized volatility over time, creating a potential source of return for premium sellers.4
That relationship is not guaranteed on an individual trade. Realized movement can exceed the implied range, particularly during earnings, regulatory decisions, or market shocks. Premium selling depends on repeated execution and controlled losses, not certainty that every implied forecast is excessive.
How High IV Changes Pricing
Why Premiums Rise
Higher IV raises call and put premiums when other pricing inputs remain unchanged. A wider expected range increases the probability that an option finishes in the money, so buyers pay more and sellers demand more compensation.
The increase appears in extrinsic value. For an at-the-money option, premium moves approximately in proportion to IV, so doubling IV can roughly double premium. This is an approximation and becomes less reliable farther from the current price.5
Volatility Skew Across Strikes
IV is not uniform across an option chain. The curve formed by different strike readings is called the volatility smile or skew. At-the-money contracts commonly show lower IV, while readings rise toward deeper in-the-money and farther out-of-the-money strikes.6
The at-the-money reading is usually quoted as the underlying's headline IV. Strike-level skew still matters when building spreads because an expensive short leg and a relatively expensive long hedge can change the net credit and exposure to volatility.
The IV Crush Risk
IV crush is a sharp volatility decline after uncertainty surrounding a known event is resolved. Earnings are the standard example. IV climbs before the announcement because the outcome is unknown, then can fall quickly after results are released.
A long call or put can lose value even when the underlying moves in the anticipated direction. If the directional gain is smaller than the loss of extrinsic value caused by falling IV, the option holder can still finish with a loss.7
High Implied Volatility Option Strategy
Covered Calls and Secured Puts
Covered calls and cash-secured puts collect richer premium when IV is elevated. A hypothetical put at the 95 strike with the underlying at $100 might trade for $7 in high IV versus $3.50 in low IV. The $7 credit places the short put's breakeven at $88, compared with $91.50 for the smaller credit.8
The better breakeven does not remove assignment or share-price risk. Sell a cash-secured put only when assignment at the effective purchase price fits the portfolio plan. Sell a covered call only when accepting an exit at the strike is consistent with the position's objective.
Credit Spreads and Iron Condors
Credit spreads define maximum loss through a long option while collecting premium from a short option. Elevated IV can increase the net credit and improve return on the capital committed. In one illustrative example, a 10-point-wide call spread collected $2.70 at 25% IV but only $1.00 at 15% IV.9
Iron condors combine put and call credit spreads to define risk on both sides. They are commonly considered when IV is above the 70th percentile. Broken wing butterflies can also express a volatility view, but their asymmetric wings create a different directional and risk profile.
Short Strangles and Straddles
Short straddles sell a call and put at the same strike. Short strangles place the short strikes apart. Both collect more credit as IV rises and can benefit from three sources:
- Theta decay as expiration approaches.
- IV compression toward its historical range.
- The underlying remaining within the profitable range.
An illustrative one-month SPX strangle collected about $280 when IV was near the 70th percentile, compared with $80 near the 25th percentile.10 The extra credit comes with greater tail risk. Undefined-risk positions require strict buying-power limits, exit rules, and a plan for gaps through either breakeven.
Selecting Strikes and Position Size
Using IV Filters
Apply IV rank or percentile to the same underlying and expiration framework used by the strategy. A basic filter might permit covered calls and put spreads above the 60th percentile, short strangles above the 65th percentile, and iron condors above the 70th percentile.11
These are filters, not automatic entry signals. Strike selection should also account for delta, expected move, skew, days to expiration, liquidity, scheduled events, and the maximum acceptable loss.
Adjusting Size by IV Regime
Regime-based sizing allocates more of a predetermined risk budget when the volatility setup is favorable and less when it is weak. It does not make each contract safer. A manager might trade 10 strangles above the 75th percentile but only 2-3 below the 25th percentile.12
Use 1-3 years of IV history where available rather than calibrating thresholds from one unusually volatile month. Define size from maximum loss or stress-tested exposure, not premium received. For undefined-risk trades, model losses beyond the displayed expected move.
Comparing Sectors and Assets
Raw IV does not support fair comparisons across underlyings. A 30% reading could be normal for a technology stock and elevated for a defensive stock. Asset-specific rolling percentiles place both readings in context.13
Sector dispersion can guide trade selection. If technology IV is at its 80th percentile and utility IV is at its 45th, a premium seller may focus research on technology while avoiding a weak credit in utilities. Liquidity and event risk still need separate checks.
Managing High-IV Trade Risk
Breakeven and Probability Math
Under a normal-distribution approximation, one standard deviation covers about 68.2% of outcomes, two cover 95.4%, and three cover 99.7%.14 A $100 stock with 20% annualized IV therefore has an approximate one-year, one-standard-deviation range of $80-$120.
A short call placed near the 84% out-of-the-money probability and a short put placed near the corresponding lower boundary produce an approximate 68% range between the strikes. Credit received widens the expiration breakevens, but fees, early exits, skew, and non-normal returns mean actual results can differ from the estimate.
Premium Selling Has Real Risk
High IV is not a free improvement in trade terms. It signals a wider distribution of potential outcomes. The larger credit compensates the seller for a greater chance of a substantial move.
A covered call still retains the downside exposure of the shares while capping gains above the call strike. Higher premium can soften a decline but cannot eliminate the stock's loss. Defined-risk spreads cap the contractual loss, while short straddles and strangles can produce losses far larger than the opening credit.15
Avoiding IV Crush When Buying
Avoid buying options solely because a scheduled event could produce movement. The option premium may already incorporate an aggressive expected move. Compare the move needed to reach breakeven with the market's implied range.
Alternatives include waiting until after the event, using a debit spread to offset part of the expensive premium, or selling premium with defined risk and closing after volatility contracts. Spreads can partially hedge IV exposure, but they also cap potential profit.16
Low and Neutral IV Alternatives
When to Favor Long Volatility
IV at or below roughly the 25th percentile can favor long straddles, long strangles, protective puts, and debit spreads. Buyers start with lower extrinsic value and can benefit from a directional move, future IV expansion, or both.
In one protective-put example, a structure cost $40 when IV was near the 20th percentile and $180 after IV rose to the 85th percentile.17 Cheap premium alone is insufficient, however. Long options still face time decay and require enough movement before expiration.
Neutral IV and Directional Trades
IV between approximately the 30th and 70th percentiles is broadly neutral, while a narrower 40th-60th range can identify conditions with little volatility edge. Bull call spreads and bear put spreads can fit trending conditions because they emphasize direction and define cost.18
Reducing size or passing is also valid. A strategy does not need continuous exposure, especially when neither premium buyers nor sellers receive favorable relative pricing.
Automating High-IV Strategies With Webhooks
Structuring Entries and Exits
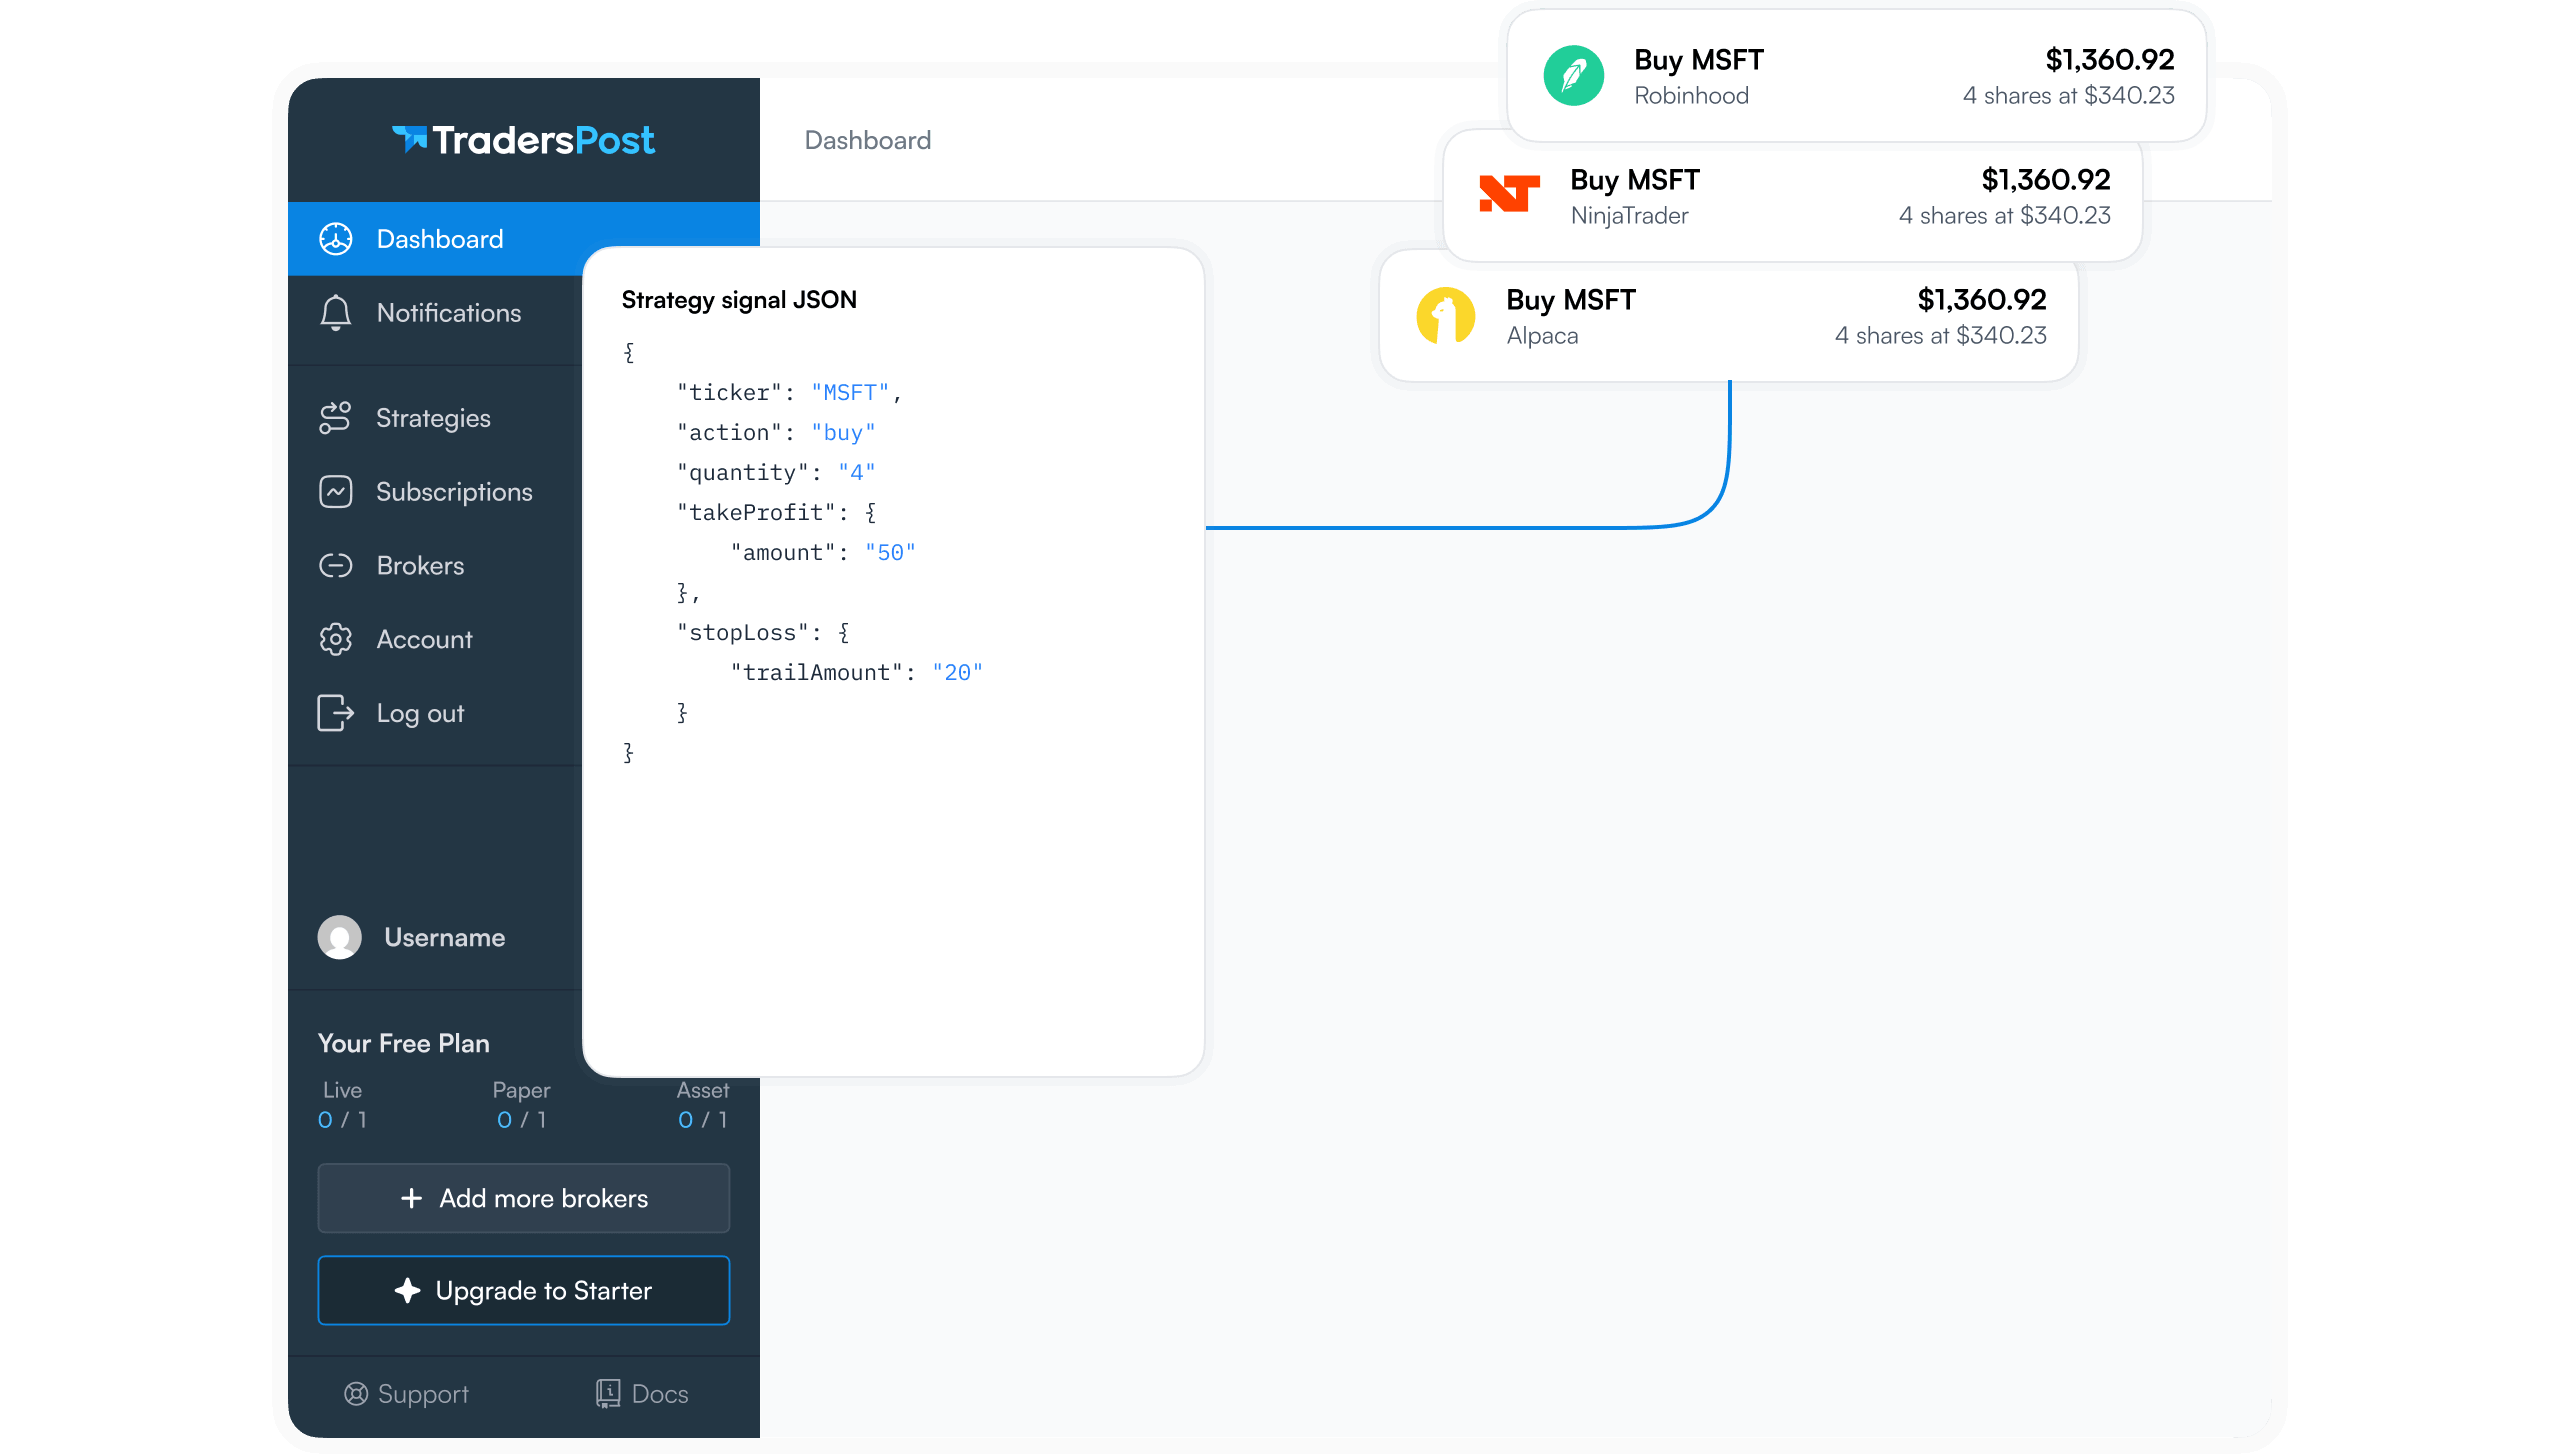
A webhook entry can include a takeProfit object using percent, amount, or limitPrice. A stopLoss object can use percent, amount, stopPrice, or trailing fields such as trailAmount and trailPercent.
Attaching exit instructions to the entry signal standardizes trade management from the time the alert fires. Before deployment, verify that order types, prices, and risk fields behave as intended with the connected broker configuration.
Selecting Contracts Through Webhooks
Option alerts can use optionType, intrinsicValue, expiration, strikePrice, strikesAway, and strikeCount to describe the desired contract. This allows an IV condition to select a strike and expiration dynamically instead of relying on a permanently fixed option symbol.
Keep the selection logic deterministic. Record the IV threshold, expiration rule, strike distance, quantity, alert price, and signal time so rejected or unexpected executions can be traced.
Testing Before Live Deployment
Paper trading supports forward testing without risking capital, although simulated fills do not reproduce live liquidity, spreads, slippage, or assignment behavior. A basic paper environment that fills orders continuously is useful for confirming alert structure and strategy configuration, not for estimating expected performance.
After configuration testing, use a broker simulation when available and review every signal before considering a small live allocation. Automated strategies still require monitoring because third-party alerts can be delayed or fail to arrive.
Connect your option alerts to a broker through TradersPost when you are ready to route contract-selection fields and predefined exit rules from your webhook workflow. Start in paper trading, verify the configuration, and move to live execution only after the alerts behave consistently.
Bottom Line
- Judge high IV with asset-specific rank or percentile, not a universal raw number.
- Elevated IV favors premium selling, but the larger credit compensates for larger expected moves.
- Match the structure to the risk limit, using defined-risk spreads when naked exposure is unacceptable.
- Scale from a fixed portfolio risk budget and reduce exposure when the volatility edge is weak.
- Test contract selection, exit fields, and alert timing before enabling live automation.
Conclusion
The best high-IV trade is not automatically the one with the largest credit. It is the structure whose breakevens, maximum loss, strike placement, and event exposure fit the account's risk limits. Use IV percentile as a regime filter, compare it with realized movement, and avoid treating mean reversion as guaranteed.
Build the process around repeatable rules: define the IV threshold, choose the permitted structures, calculate size from risk, attach exits, and test the full signal path. That turns volatility from a vague market observation into an actionable strategy input.
Frequently Asked Questions
What Is Considered High IV?
There is no fixed threshold because each underlying has its own range. ETFs typically run lower IV than individual stocks. An IV rank or percentile above roughly 70-75 is commonly treated as high relative to the underlying's history.
How Does High IV Affect Prices?
Higher IV increases option premiums and extrinsic value, all else equal. For an at-the-money option, doubling IV can roughly double the premium, although the relationship is less direct away from the current price.
How Do Rank and Percentile Differ?
IV rank places current IV between its 52-week low and high. IV percentile measures the percentage of lookback days when IV was lower. Rank is more sensitive to one extreme high or low because those observations change the full range.
Why Can Favorable Options Lose?
IV crush can reduce extrinsic value after earnings or another scheduled event. If that volatility loss exceeds the value gained from the favorable stock move, the option can decline despite getting the direction right.
Should I Buy or Sell?
High IV generally favors premium-selling structures such as covered calls, credit spreads, and short strangles. It also signals wider expected movement, so selling still carries material risk. Buyers pay more and need enough movement or further IV expansion to overcome the elevated entry premium.
References
1 What Is Implied Volatility in Options Trading?
2 Investing 101: Volatility
3 IV Considerations by Strategy
4 What Is Implied Volatility in Options Trading?
5 Why Implied Volatility Matters
6 Why Implied Volatility Matters
7 Why Implied Volatility Matters
8 What Is Implied Volatility in Options Trading?
9 IV Considerations by Strategy
10 IV Considerations by Strategy
11 IV Considerations by Strategy
12 IV Considerations by Strategy
13 IV Considerations by Strategy
14 What Is Implied Volatility in Options Trading?
15 Why Implied Volatility Matters
16 Options Implied Volatility
17 IV Considerations by Strategy
18 Options Implied Volatility