Why Automated Trading Strategies Fail
Learn why automated trading strategies fail in live markets: curve-fitting, overlooked costs, and weak risk rules—and how to test before live deployment.

Marketing

Bottom Line
- Backtests often assume perfect market conditions, but live trading introduces factors like widened spreads and slippage that can quickly erode profitability.
- A strategy with an average modeled profit of $0.08 per share can become unprofitable if live trades enter $0.03 above and exit $0.03 below the modeled price.
- Over-optimization can lead to strategies that perform well historically but fail in live markets due to capturing noise rather than durable market behavior.
- TradingView strategy backtests default to zero commission and slippage, which can overstate performance as these costs are significant in live trading.
- Realistic execution friction can reduce backtest results by 30% to 50%, affecting strategies with small expected gains per trade.
A strategy can look flawless across five years of backtest data, then lose money within weeks of going live. That gap is the real answer to why automated trading strategies fail: historical results often assume clean fills, stable volatility, unlimited liquidity, and execution costs that barely resemble actual market conditions. In options markets, where spreads widen, implied volatility shifts, and assignment risk can alter exposure overnight, those assumptions can become expensive fast.
This article breaks down the failure points that turn promising systems into underperforming live portfolios. You will learn how curve-fitting creates fragile rules, why slippage and commissions can erase a statistical edge, how regime changes invalidate historical relationships, and where weak position sizing turns a manageable drawdown into a strategy-ending loss.
More importantly, you will get a practical framework for pressure-testing an automated strategy before committing capital. From out-of-sample testing and realistic fill assumptions to stress scenarios and risk limits, these checks can help distinguish a durable trading process from a backtest that only worked on paper.
Why Profitable Backtests Often Fail in Live Trading
A Backtest Is a Model, Not a Guarantee
A backtest evaluates how a defined set of trading rules would have performed on historical data. It does not establish how those rules will perform in the next market regime, during a volatility shock, or under the execution conditions of a live brokerage account.
Every result depends on assumptions. The test must decide which price represents an entry or exit, whether a signal can be filled immediately, what commissions and fees apply, how much slippage occurs, and whether sufficient liquidity exists at the modeled price. It also depends on the quality and granularity of the data. A strategy tested on bar-close data may appear to enter at a known closing price, while a live alert generated at that close can only be submitted after the market has already moved.
The objective is not to discover a perfect equity curve. It is to develop rules that remain viable when execution is imperfect. Treat a backtest as an estimate with uncertainty, then test whether the strategy can tolerate worse fills, higher costs, delayed signals, and periods when its historical edge weakens.
The Gap Between Simulated and Live Execution
Live trading adds frictions that many backtests either simplify or omit: bid-ask spreads, slippage, delayed fills, partial fills, gaps between signal generation and execution, rejected orders, and changing liquidity. Automation applies the rules consistently, but it does not eliminate these risks.
Consider a short-term strategy that produces an average modeled profit of $0.08 per share per trade. If the backtest assumes fills at the midpoint or last-traded price, it may show a strong profit factor. In live trading, entering $0.03 above the modeled price and exiting $0.03 below it reduces the edge by $0.06 per share before commissions, fees, and occasional larger slippage. A strategy with a narrow expected gain can become unprofitable even though its signals are directionally correct.
- Model conservative fills: Test entries at or beyond the ask for buys and exits at or below the bid for sells when appropriate.
- Stress transaction costs: Increase estimated commissions, fees, and slippage until the strategy's expected return is clearly robust.
- Examine timing: Verify whether the signal is based on completed data and whether the intended order can realistically be placed at the modeled time.
- Use Paper trading carefully: It can validate alert flow and order logic, but paper results may still differ from live fills.
The Three Failure Modes to Examine First
When a profitable backtest fails live, begin with three diagnoses: over-optimization and curve-fitting, underestimated costs, and weak risk rules.
Over-optimization occurs when parameters are tuned so precisely to past price behavior that they capture noise rather than a durable market effect. Underestimated costs allow marginal strategies to appear profitable. Weak risk rules allow a normal losing streak, gap, or regime change to cause losses large enough that the strategy cannot recover.
These failures compound. A curve-fit strategy may show exceptional returns in a cost-free backtest because it trades frequently and captures small historical moves. Once realistic spreads and slippage are applied, the edge disappears. If position sizing is aggressive and stops are too wide, the first adverse live period can produce losses far larger than the backtest implied. Evaluate robustness before optimizing returns: use out-of-sample periods, vary key parameters, apply adverse execution assumptions, and confirm that risk remains acceptable when the strategy is wrong.
Failure Mode #1: Over-Optimization and Curve-Fitting
What Curve-Fitting Looks Like in an Automated Strategy
Curve-fitting occurs when strategy settings are tuned so closely to past price action that they capture historical noise rather than durable market behavior. The resulting rules may explain every favorable swing in a backtest, but they often fail when prices, volatility, liquidity, or trend conditions change.
Common warning signs include:
- Repeated changes to inputs until the equity curve improves.
- Highly specific entry filters, such as requiring several indicator thresholds, exact price relationships, and a particular bar pattern simultaneously.
- Very narrow Trading Windows selected because they exclude a handful of historical losing trades.
- Moving-average lengths, stop distances, profit targets, or time filters chosen solely because they produced the highest past net profit.
A strategy can display an impressive historical equity curve and still lack a repeatable edge. Smooth results are not proof that the rules identify a persistent opportunity. They may instead reflect a model tailored to the accidental sequence of prices in the test period.
Too Many Parameters Create False Precision
Consider a trend strategy that tests moving-average lengths from 5 to 100 bars, Stop Market distances from 0.25% to 3%, profit targets from 0.5% to 6%, and multiple Trading Windows. After hundreds or thousands of combinations, one configuration may produce the highest historical return. That does not mean it is the best live configuration.
The key question is whether nearby settings also work. If a 21/55 moving-average pair, 1.2% stop, and 2.4% target performs exceptionally well, but a 20/55 pair or 1.3% stop performs poorly, the result is fragile. Small, economically irrelevant changes should not destroy a genuine edge.
Favor broad parameter regions that remain reasonably stable. For example, a strategy may be more credible if moving-average pairs between 18/50 and 25/65, stops between 1.0% and 1.5%, and targets between 2.0% and 3.0% all produce acceptable expectancy, drawdown, and trade frequency. Select robust settings, not the single historical winner.
Use Out-of-Sample and Forward Testing
Split historical data into at least two periods. Use the development period to define rules and choose reasonable parameter ranges. Then evaluate the unchanged strategy on an unseen validation period. Do not revise settings after seeing validation results without treating that revised process as a new development cycle.
Walk-forward testing is stronger because it repeatedly develops and validates settings across multiple market regimes, including sustained trends, range-bound periods, high-volatility selloffs, and low-volatility conditions.1 A strategy that only succeeds during one favorable regime is not sufficiently validated for automation.
After backtesting, begin with small, controlled exposure in Paper trading or limited live size. Compare actual fills, slippage, trade timing, and realized outcomes with backtest assumptions. The objective is not immediate scale, but confirmation that the strategy behaves in real execution as expected.
Avoid Signals That Change After the Fact
Some indicators and strategy conditions can look highly reliable in hindsight because they use information that was not fully available when the original signal occurred. This is commonly called repainting.2 A signal may appear on a completed historical bar, yet not have existed in real time while that bar was forming.
Verify that every entry and exit condition is evaluated using information available at the decision point. Confirm whether signals can change as bars update, whether higher-timeframe values are finalized before use, and whether alerts are based on confirmed conditions rather than temporary intrabar states.
TradingView documents common repainting behaviors and the distinctions between historical and real-time calculations in its repainting documentation. Review that guidance before relying on any alert-driven automation. A backtest is only meaningful when its signals could have been generated at the same time they appear in the historical record.
Failure Mode #2: Ignoring Slippage, Spreads, and Commissions
Why Default Backtest Costs Can Be Misleading
TradingView strategy backtests assume zero commission and zero slippage by default unless the trader changes those assumptions.3 That default can materially overstate historical performance because it treats entries and exits as if they occur at the exact modeled price, with no bid-ask spread, brokerage fee, exchange fee, or adverse fill variation.
This matters most for frequent strategies, small-target systems, and intraday approaches. Even highly liquid instruments have spreads, and fills can vary from the price visible when a signal occurs. A strategy that holds positions for minutes and seeks small gains may appear highly efficient in a zero-cost backtest while having little or no executable edge after realistic trading friction. A robust, low-cost strategy may remain profitable under realistic assumptions. A marginal strategy often does not.
How Small Costs Can Erase a Strategy's Edge
Consider a strategy that produces an average gross profit of $0.12 per share before costs. If the combined effect of crossing the spread, commissions, fees, and adverse fill prices exceeds $0.12 per share, the strategy becomes unprofitable despite a positive backtest result.
The effect compounds with trade frequency. A system that makes a small expected amount on each trade may execute hundreds of entries and exits per month. Each round trip pays execution friction again. Small intraday moves are particularly vulnerable because a one- or two-cent difference at entry and exit can consume a substantial percentage of the intended profit.
Vendor testing may estimate that realistic execution friction reduces some backtest results by roughly 30% to 50%. Treat that as a testing observation, not a universal statistic or performance guarantee. The actual impact depends on the instrument, order type, trade size, market conditions, and how aggressively the strategy seeks fills.
Model Conservative Assumptions Before Trusting Results
Set commission and slippage assumptions intentionally conservatively rather than selecting values that preserve an attractive equity curve. Review the conditions your orders are likely to face:
- Typical bid-ask spread for the specific stock, ETF, future, or option contract.
- Expected order behavior, including whether entries and exits require crossing the spread.
- Liquidity at the strategy's intended position size.
- Time-of-day effects, especially wider spreads near the open, close, and low-volume periods.
- Whether stops or urgent exits are likely to fill beyond their trigger price during volatility.
Then retest after increasing both commission and slippage assumptions. Do not evaluate net profit alone. Confirm that profitability, profit factor, win rate, and drawdown remain acceptable after costs. If modestly harsher assumptions eliminate the edge, the strategy is too dependent on idealized execution.
Account for Alert-to-Order Execution Realities
The price shown when an alert triggers is not necessarily the final broker fill price. Between the alert, order submission, market routing, and execution, the market can move. This gap can be especially important for automated strategies entering with marketable orders or exiting under stop conditions.
Use a limited validation period to compare three records for each trade: the alert price, the submitted order price, and the completed trade result. Measure the difference by instrument, session, and order type. Pay particular attention to economic releases, market openings, market closes, and sudden price moves, when spreads can widen and fill quality can deteriorate sharply.
Failure Mode #3: Weak Risk Rules Turn Losses Into Major Drawdowns
An entry signal is not a complete trading plan
An automated entry signal answers only one question: when to open a position. A complete strategy must also define the exit, position size, maximum acceptable loss, and the action taken when the original trade thesis is wrong. Without those rules, automation can enter trades consistently while allowing losses to vary unpredictably.
Strategies built primarily to maximize win rate are especially vulnerable. A system that takes many small gains may appear reliable until one infrequent loss exceeds the profit from dozens of winners. Evaluate the strategy through expectancy, not win rate alone. Expectancy depends on the relationship among win rate, average winning trade, average losing trade, and trading costs. A 70% win-rate strategy can still lose money if its losing trades are materially larger than its winners after commissions, spreads, and slippage.
- Define the entry condition and order type.
- Define the stop-loss or invalidation level before the trade is entered.
- Define the profit-taking or trailing-exit logic.
- Define position size based on the planned loss if the stop is reached.
Use stop-loss rules to define the trade invalidation point
A stop-loss should represent the price level at which the trade thesis is no longer valid, not an arbitrary dollar amount of pain. For example, a breakout strategy may buy when price closes above a well-defined range. If price falls back below the breakout range, the breakout premise may be invalid. A Stop Market order can therefore be placed below that level, with sufficient room for normal intraday movement and spread variation.
Stop placement must be tested with the entry logic. A tighter stop reduces the loss on each stopped-out trade, but it may also increase stop-out frequency by exiting positions during ordinary pullbacks. A wider stop may keep more valid trades alive, but it increases the loss per share or contract and requires smaller sizing. Test both outcomes across different volatility regimes rather than selecting a stop distance solely because it produced attractive recent results.
Use Trailing Stop rules thoughtfully
A Trailing Stop can protect open gains as a trade moves favorably, but it can also close a position too early during a normal retracement.4 This trade-off is particularly important in trend-following systems, where the largest winners often include several pullbacks before the trend resumes.
A fixed profit target can improve consistency by realizing gains at a predefined level. A trailing exit may produce fewer, more variable winners, but can retain exposure to extended trends. Neither approach is inherently superior. Test trailing distances across quiet, volatile, trending, and range-bound conditions. A distance that works in a low-volatility market may repeatedly exit profitable trades when volatility expands.
Size positions with Risk percent sizing
Equal share quantities do not produce equal risk. Buying 100 shares with a $0.50 stop exposes approximately $50 before costs, while 100 shares with a $3.00 stop exposes approximately $300. When stop distances vary, fixed quantities can cause a small number of wide-stop trades to dominate total drawdown.
Risk percent sizing aligns position size with a predefined portion of account risk and the distance between entry and stop-loss.5 If a trader risks 1% of account equity per trade, a wider stop should generally result in a smaller position, while a tighter stop can support a larger position. This creates more consistent loss limits across trades and prevents position size from becoming an untested source of leverage.
How to Build a More Durable Automated Strategy
Start With a Simple, Explainable Trading Hypothesis
Before automating any rules, describe the strategy in plain language. A durable strategy begins with a specific answer to three questions: what condition does it target, why might that condition create an edge, and when should the strategy stand aside?
For example, a trend-continuation hypothesis might be: “When a liquid index is in an established uptrend, a short pullback may offer an entry because buyers often defend the prevailing trend.” A mean-reversion hypothesis might be: “After an unusually large one-day decline in a broad, liquid market, short-term selling pressure may be exhausted, creating a potential rebound.”
Both hypotheses are understandable before any indicators, alerts, or order settings are added. That matters because every automated rule should support the underlying idea. If a condition cannot be explained, it is difficult to know whether it is protecting against a real risk or merely improving a historical backtest.
- Define the market and timeframe the strategy is intended to trade.
- Specify the entry condition, exit condition, and conditions that prohibit trading.
- Begin with a small number of meaningful rules rather than adding filters until historical results appear ideal.
- Reject rules that only improve results over a narrow historical sample without a credible market rationale.
A strategy with three well-understood conditions is usually easier to validate and maintain than one with fifteen optimized thresholds.
Test Across Different Market Regimes
Markets do not behave consistently. A breakout system may perform well during persistent bull or bear trends and lose repeatedly during sideways, low-volatility periods. A mean-reversion strategy may benefit from range-bound conditions but suffer when a large move develops into a sustained trend.
Evaluate the same rules across distinct environments:
- Bull markets: persistent upward price movement and shallow pullbacks.
- Bear markets: persistent declines, sharp rallies, and elevated downside risk.
- High-volatility periods: wider intraday ranges, larger gaps, and less stable execution.
- Low-volatility periods: compressed ranges and fewer meaningful price moves.
- Sideways markets: repeated reversals without sustained directional follow-through.
Do not rely on a single all-time net-profit figure. Report results by calendar period and market condition. A strategy that earns most of its profit during one exceptional year may be far less durable than a strategy with smaller, more consistent results across multiple regimes.
Measure More Than Total Return
Total return alone does not describe whether a strategy is tradable. A high-return backtest may require a drawdown, losing streak, or individual loss that the trader cannot realistically tolerate. If the strategy would likely be disabled at its worst historical point, its apparent return is irrelevant.
Review at least the following metrics:
- Maximum drawdown: the largest peak-to-trough equity decline.
- Average trade: expected profit or loss per completed trade.
- Win rate: the percentage of profitable trades.
- Profit factor: gross profit divided by gross loss.
- Number of trades: whether the sample is large enough to support confidence.
- Largest loss: the worst single-trade outcome.
- Consecutive losses: the longest historical losing streak.
Compare results only after realistic commission and slippage assumptions are included. A strategy with a small average trade can appear profitable before costs, then become unprofitable once actual execution friction is applied.
A Practical Pre-Live Checklist for Automated Trading
Validate the Signal and Alert Logic
Before sending an alert to an automated workflow, verify that the strategy uses only information available when the trade decision would actually occur. A backtest can look unusually strong if it relies on an indicator value that is finalized only after the bar closes, while the strategy assumes an entry earlier in that same bar.
TradingView scripts require particular attention to repainting and alert timing. Determine whether the strategy is designed to act:
- At bar close, using confirmed values from a completed candle.
- Intrabar, using values that can change before the candle closes.
- On the next bar, after a confirmed signal has been produced.
If a moving-average crossover appears during a five-minute bar but disappears before the close, an intrabar alert may enter a trade that does not exist in a bar-close backtest. Align the alert configuration, the script’s signal conditions, and the assumptions used in testing. A bar-close strategy should not be evaluated as though it could consistently enter at the best intrabar price.
Each alert should represent one unambiguous trading decision. For example, a long-entry alert should not also imply that the system should close a short position, reverse direction, and attach new exits unless those instructions are explicitly defined and tested. Review alert frequency and duplicate-signal conditions so one market event does not produce multiple orders.
Include Complete Order Instructions
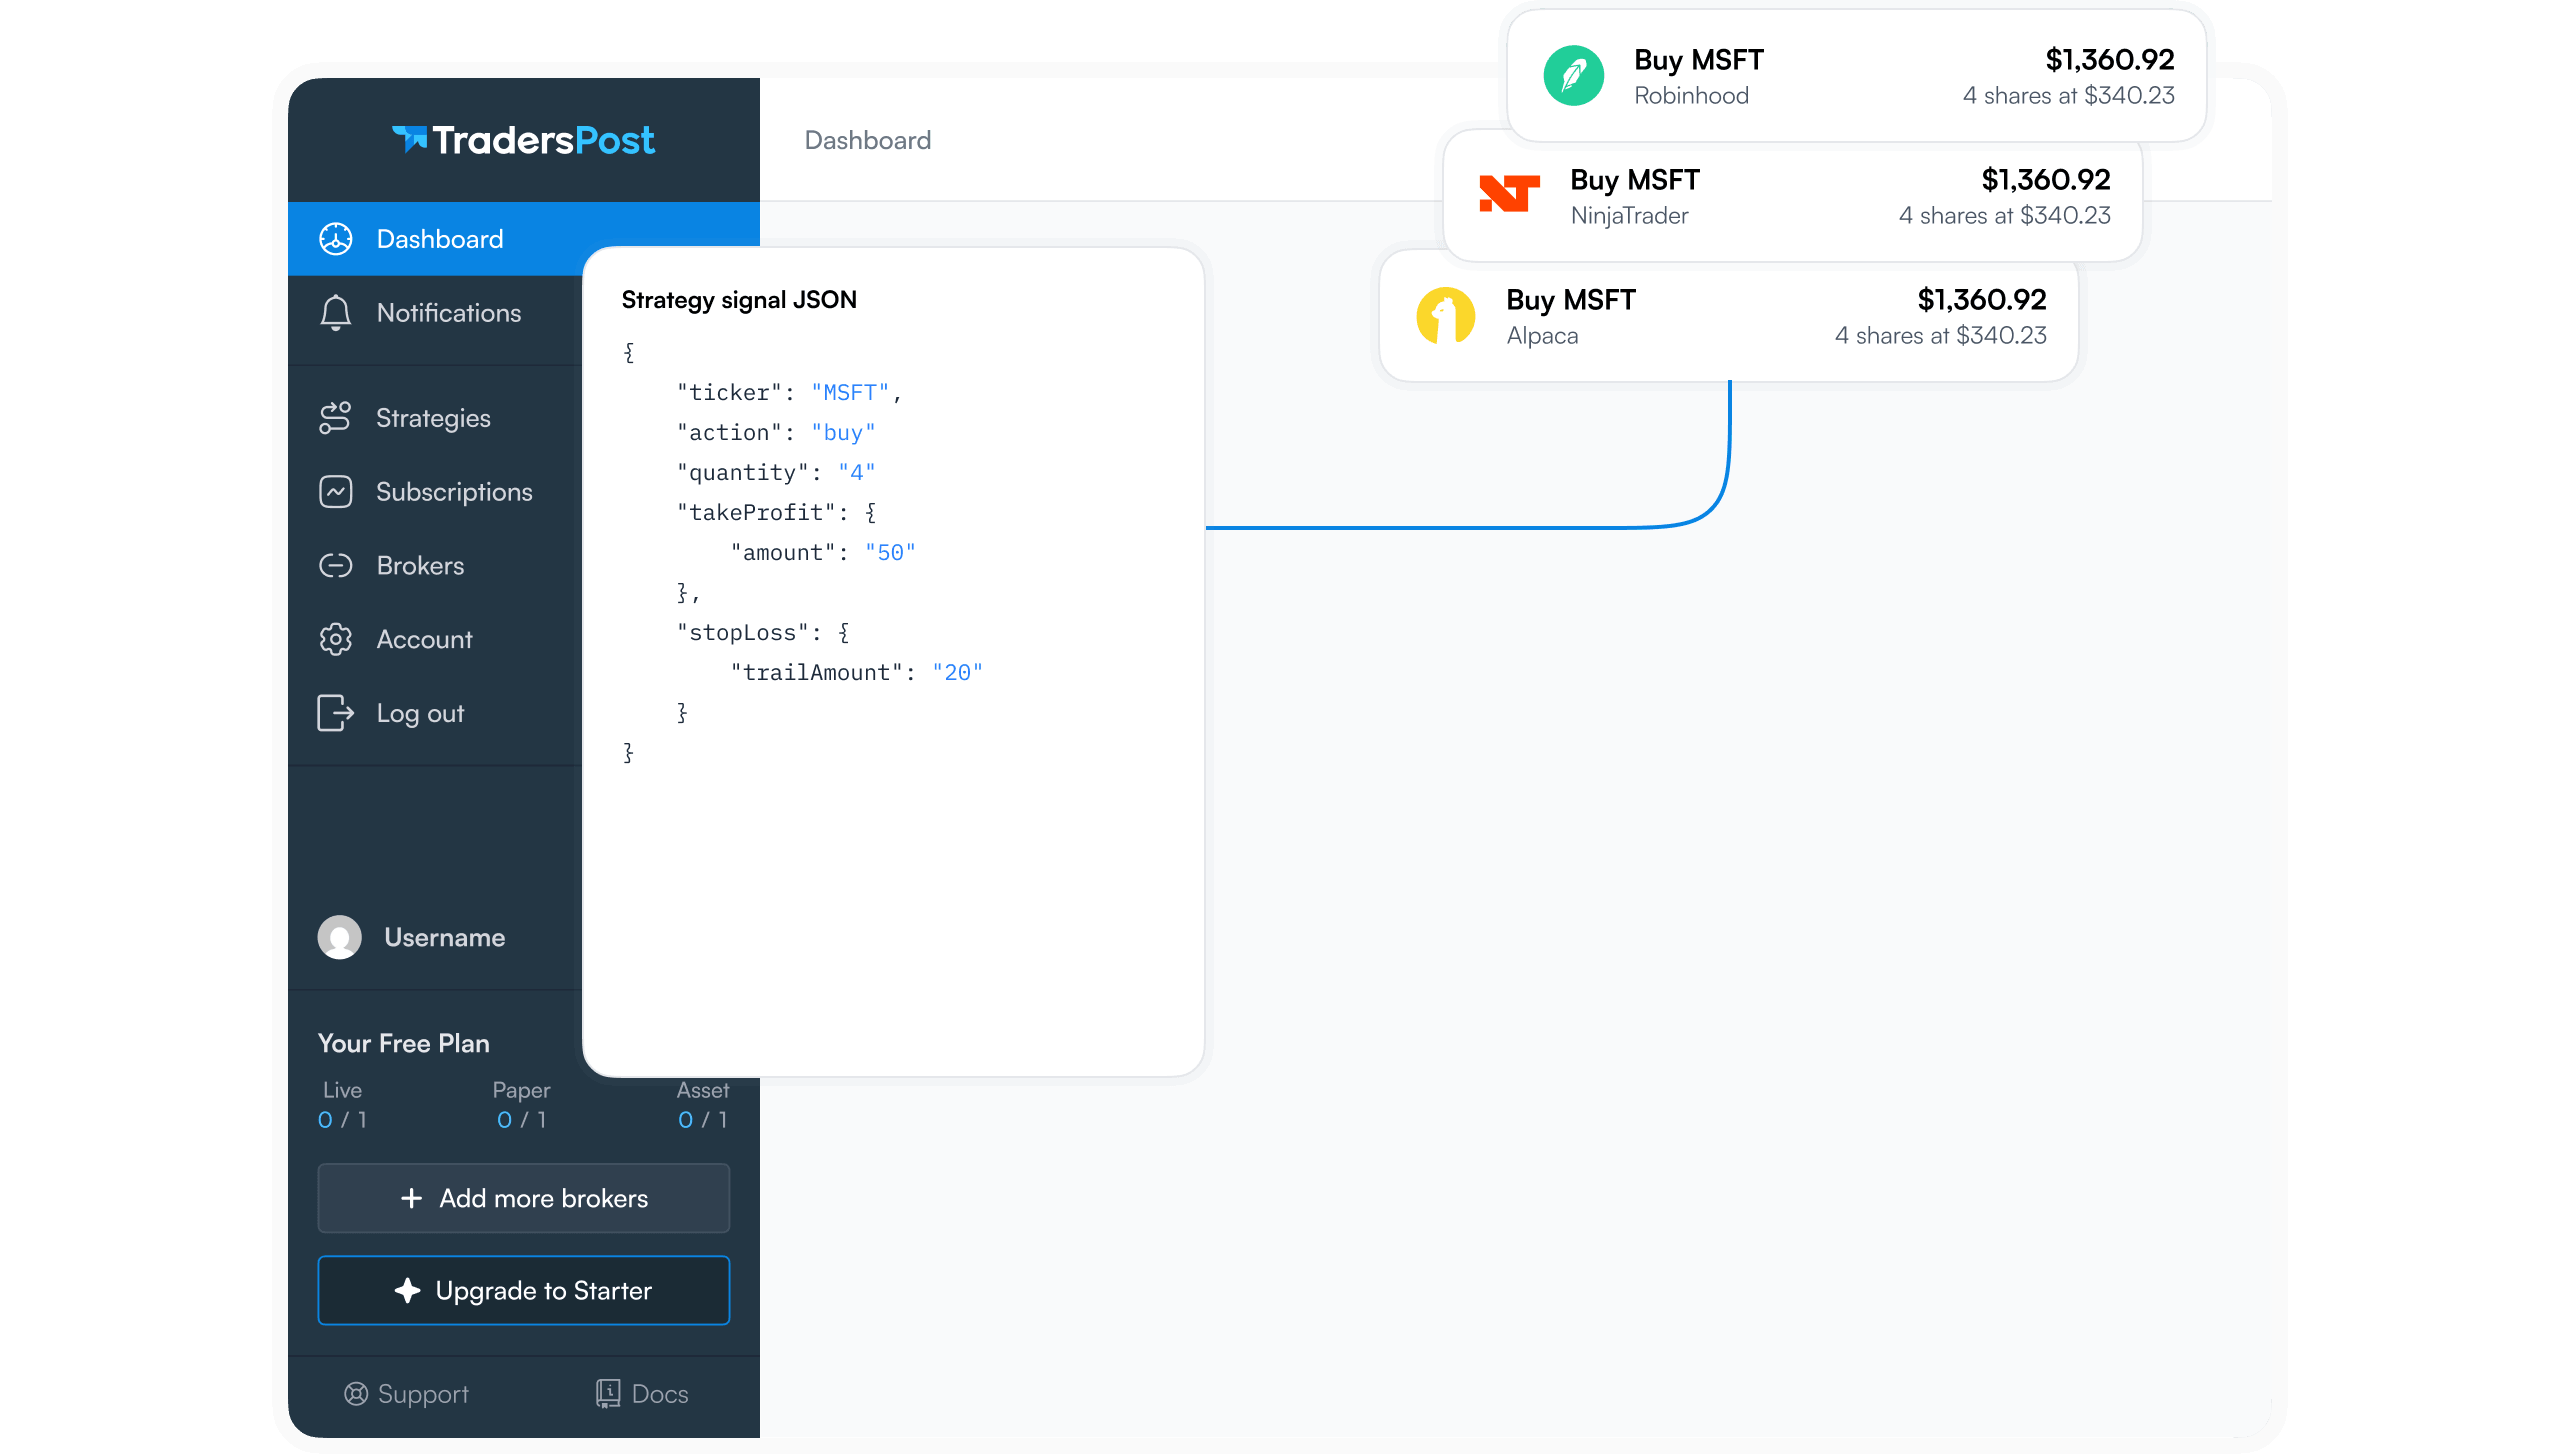
An alert is not a complete trading instruction unless it identifies what to trade, which direction to trade, and how much exposure to take. At minimum, define the ticker, action, and either a fixed quantity or a sizing method consistent with the strategy’s risk model.
When relevant, include documented webhook fields such as takeProfit, stopLoss, and expiration. For example, an alert for a long trade might specify a ticker, a buy action, a quantity of 100 shares, a stop loss below the entry structure, and a take-profit level derived from the same rules used in the backtest.
- Use the same symbol format throughout the signal, alert, and trading workflow.
- Do not substitute a fixed quantity in live trading if the tested strategy used Percent of equity or Risk percent sizing.
- Ensure stop-loss and take-profit instructions match the tested exit logic, including whether values are price levels or calculated from the entry setup.
- Use expiration only when the strategy has a defined reason to cancel an unfilled order after a specified time.
Incomplete instructions create discretionary decisions at the exact point automation is intended to remove them.
Run a Limited Validation Period
Begin with small exposure or Paper trading and compare live workflow behavior against the modeled strategy. The objective is not to prove that every trade wins. It is to confirm that alerts, entries, exits, and trading costs behave within a reasonable range of the assumptions used in testing.
Maintain a trade log with the expected and actual entry price, exit price, commission, slippage, stop or target behavior, and final trade outcome. If a model assumes a $50.00 entry but repeated actual fills occur near $50.20, that difference can materially change results for short-horizon strategies.
Do not rewrite the rules after each losing trade. Collect a meaningful set of observations first, then identify whether deviations are caused by signal timing, market liquidity, order execution, costs, or flawed assumptions. Frequent reactive changes replace one over-optimized backtest with another.
When to Revise, Pause, or Retire a Strategy
Separate Normal Drawdowns From Broken Assumptions
Every strategy has a loss distribution. A sequence of losing trades is not, by itself, evidence that the strategy has failed. Before going live, define the performance ranges that are acceptable for the strategy, including maximum expected drawdown, average trade expectancy, win rate, and the longest likely losing streak.
Compare live results against the same measurements from testing. For example, a strategy with a tested maximum drawdown of 12%, an average trade of $45, and historical losing streaks of six to eight trades should not automatically be retired after four consecutive losses. Those losses may be statistically ordinary if execution quality and market conditions remain comparable to the test period.
- Revise when live performance persistently falls outside predefined ranges.
- Pause when drawdown exceeds the strategy’s risk limit or when market conditions materially differ from those tested.
- Retire when the strategy’s core premise no longer holds across a meaningful sample of trades.
A meaningful sample matters. Do not abandon a strategy after a handful of losses that remain within its tested drawdown and loss-streak profile. Conversely, do not excuse a deteriorating system indefinitely because losses are “possible.” The decision rule should be established before the drawdown occurs.
Investigate Execution Problems Before Changing Strategy Rules
When live results differ from backtest results, inspect execution before rewriting entry or exit logic. The gap may be caused by slippage, wider bid-ask spreads, delayed alerts, order setup, insufficient liquidity, or a market regime that the test did not adequately represent.
Review individual trades rather than only aggregate profit and loss. Check whether the expected ticker, action, quantity, stopLoss, takeProfit, and expiration instructions were sent, whether fills occurred materially away from the modeled price, and whether the strategy traded during conditions that made the spread or slippage unusually costly. A small expected edge can disappear quickly when average execution costs increase.
Changing parameters to recover recent losses is a common route to curve fitting. Tightening a stop, changing a moving-average length, or narrowing a Trading Window because it would have avoided the last few losses may improve an in-sample chart while weakening future performance. Make one documented change at a time, state the hypothesis in advance, and retest it on out-of-sample data. If the change cannot improve robustness across unseen periods, it is not a reliable improvement.
Treat Automation as an Ongoing Risk-Management Process
Automation does not eliminate supervision. It shifts the trader’s work from discretionary order entry to disciplined review of assumptions, execution costs, position sizing, risk controls, and live performance. Schedule regular reviews and compare the live strategy with its tested expectations before making changes.
Durable automated strategies are usually simple enough to explain, conservatively tested across different conditions, realistic about trading costs, and built around defined risk. A strategy using controlled sizing, clear exit rules, and a predetermined drawdown limit is generally more resilient than a backtest optimized for the highest possible return.
Prioritize survival and consistency over an impressive but fragile equity curve. A strategy that can endure ordinary losing periods, costs, and changing conditions has a stronger foundation than one that succeeds only under narrowly optimized assumptions.
Frequently Asked Questions
Why do automated trading strategies fail after working in backtests?
Automated strategies can fail live because backtests often use overly favorable assumptions for fills, commissions, slippage, liquidity, and signal timing. A strategy may also be curve-fitted to historical data, meaning it performed well by matching past noise rather than a repeatable edge. Changing market conditions can expose those weaknesses. In addition, weak stop-loss and position-sizing rules can turn normal losing streaks into outsized account drawdowns.
Does TradingView include commission and slippage in backtests?
TradingView strategy backtests assume zero commission and zero slippage by default unless you change those settings. Before relying on reported results, add realistic, and preferably conservative, transaction-cost assumptions that reflect your broker, market, order type, and expected fills. These costs can have an especially large impact on high-frequency strategies or systems designed to capture small price moves, where modest friction can eliminate much of the apparent edge.
What is curve-fitting in automated trading?
Curve-fitting occurs when a strategy is tuned so precisely to historical price behavior that it captures random noise instead of a durable market edge. Warning signs include too many parameters, overly narrow input ranges, and performance that drops sharply when settings change slightly. To reduce this risk, test the strategy on out-of-sample data and use forward validation. A robust strategy should remain reasonably stable across different periods and settings.
How can risk percent sizing improve an automated strategy?
Risk percent sizing sets position size based on a predefined percentage of account risk rather than using the same share or contract quantity for every trade. This can be especially useful when stop-loss distances vary, because equal quantities can create very different potential losses. By sizing each trade relative to its stop-loss distance, traders can make risk more consistent. Test the approach alongside the strategy’s stop-loss rules and realistic transaction-cost assumptions.
Can TradersPost automate stop-loss and take-profit instructions from TradingView alerts?
Yes. TradersPost supports documented webhook fields including ticker, action, quantity, takeProfit, stopLoss, and expiration.6 Traders should confirm that every alert instruction matches the exact strategy rules used during testing, including sizing and exit logic. Automation can improve execution consistency, but it does not eliminate market risk, slippage, missed fills, or the need to monitor and review strategy performance over time.
Conclusion
Automated trading strategies rarely fail because automation itself is flawed. They fail when fragile assumptions, overfitted rules, poor data, unrealistic execution models, or weak risk controls are carried from backtest to live markets without sufficient validation. A strategy must be robust across market regimes, account for slippage and fills, and include clear limits for position sizing, drawdowns, and operational errors.
After completing your pre-live checklist, connect validated TradingView alerts to your broker through TradersPost and begin with conservative, risk-defined automation. Start small, monitor every order path, and treat early live trading as another stage of testing rather than proof of success.
Review your strategy regularly as conditions change, and be willing to pause or revise it when performance deviates from expectations. Disciplined automation can turn a well-tested process into a more consistent trading workflow. Take the next step with TradersPost and automate with confidence.
References
1 QuantInsti, Walk-Forward Optimization
2 TradingView, Pine Script Repainting
3 TradingView, Strategy Properties
4 TradersPost Docs, Order Classes
5 TradersPost Docs, Position Sizing
6 TradersPost Docs, Webhooks