What a Bullish CCI Crossover Means
A bullish CCI crossover at zero and at +100 signal different things. Learn which level to trade, when each whipsaws, and how to make the rule more robust.

Marketing

A bullish CCI crossover sounds like a single concept until you ask which level the line is crossing. Crossing zero and crossing +100 are two different signals with different reliability profiles, different lag characteristics, and different ideal market conditions. Picking the wrong one for your setup is how a technically correct rule produces a losing string of trades.
The Commodity Channel Index was developed by Donald Lambert and published in Commodities magazine in 1980.1 It measures where the current typical price sits relative to its own lookback-period average, and Lambert's scaling choices are what give the +100 and -100 levels their meaning. Understanding those choices is the foundation for trading any CCI crossover rule.
This article walks through what each crossover level actually signals, where each one breaks down, how to make either rule more durable with complementary tools, and how to wire a CCI crossover alert into an automated order flow.
What CCI Actually Measures
Typical Price vs. Its Average
CCI measures the difference between a security's typical price and its average typical price over a set period.1 Typical price is calculated as (High + Low + Close) divided by 3. The result is then scaled by a constant and the mean deviation of those typical prices over the lookback window.
High positive readings mean price is well above its average, which the documentation describes as a show of strength. Low negative readings mean price is well below its average, a show of weakness.1 The number itself carries directional information, not just magnitude.
Why Lambert Set .015
Lambert set the constant at .015 to ensure that approximately 70 to 80 percent of CCI values fall between -100 and +100.1 That scaling decision is what gives those two levels their analytical weight: readings outside the band represent genuinely unusual price behavior, not routine fluctuation.
The lookback period affects how tight that band is in practice. A shorter CCI, such as 10 periods, is more volatile with a smaller percentage of values between +100 and -100. A longer CCI, such as 40 periods, has a higher percentage of values inside the band.1 Changing the period changes how often +100 and -100 get reached, and therefore how much meaning to assign when they are.
Coincident vs. Leading Use
CCI can function as a coincident indicator or a leading indicator, and the distinction matters for how you interpret a crossover. As a coincident indicator, a CCI surge above +100 reflects strong price action that can signal the start of an uptrend; a plunge below -100 can signal the start of a downtrend.1 In this mode, the crossover confirms that something is happening now.
As a leading indicator, CCI identifies overbought or oversold conditions that may foreshadow a mean reversion. Bullish and bearish divergences between CCI and price can detect early momentum shifts and anticipate trend reversals before they fully develop.1 The same indicator, read differently, gives an earlier but less confirmed signal.
The Zero Line Cross
What Zero Actually Means
A CCI reading of zero means the typical price equals its own lookback-period average exactly. Crossing above zero signals that the typical price has moved above that average, which is a trend-change cue rather than a momentum extreme. The StockCharts documentation frames it plainly: CCI technically favors bulls when positive and bears when negative, so the zero line is the simplest dividing line.1
Why Zero Whipsaws in Sideways Markets
The problem with zero-line crosses as trade entries is frequency. Using simple zero-line crossovers can result in many whipsaws.1 In a ranging market the typical price crosses its own moving average repeatedly, so CCI crosses zero repeatedly, generating contradictory signals in quick succession. Each cross looks like a valid entry by the rule but produces no follow-through because price has no directional conviction.
Zero-line crosses work better as context filters than as standalone entry triggers. Knowing that CCI is positive tells you the broad bias; acting on every cross of zero is a different matter.
Confirming a Zero Cross
The documented approach to filtering zero-line signals involves requiring additional confirmation. A bullish divergence can be confirmed with a break above zero in CCI or a resistance break on the price chart.1 Requiring that price structure event before acting on the CCI cross removes a significant share of false entries. Divergences that are not confirmed by a zero-line crossover or a price structure break often fail to produce a reversal.1
The +100 Cross: Stronger Signal
Why +100 Is the Documented Threshold
Because Lambert scaled CCI so that roughly 70 to 80 percent of readings stay inside the -100 to +100 band, a move above +100 represents unusual strength by design.1 A move that exceeds this range shows unusual strength or weakness that can foreshadow an extended move.1 Think of these levels as bullish or bearish filters.
Requiring a move above +100 for a bullish signal reduces whipsaws compared to the zero line, though entry points will lag more.1 That tradeoff is explicit in Lambert's original framework and is not something specific to any one implementation.
The Lag Tradeoff
Waiting for CCI to cross +100 means missing the early part of a move. CCI does not catch the exact top or bottom, but it can help filter out insignificant moves and focus on the larger trend.1 The practical benefit is that by the time the +100 level is crossed, the move has enough momentum behind it to be worth trading, even if the entry price is higher than ideal.
The tradeoff between fewer false signals and later entries is real and must be factored into stop placement. An entry that arrives later in a move has a shorter distance back to where the thesis would be invalidated, which affects where a logical stop sits and therefore how the position can be sized.
Bull Mode Continuation Logic
Once CCI crosses above +100 and enters what chartists call bull mode, subsequent pullbacks can be treated as entry opportunities rather than reversals. Notice that a stock can retrace a meaningful portion of its prior advance and still remain in a bullish CCI regime if CCI holds above zero.1 The subsequent surge above a flag trend line, for instance, provides another bullish signal with CCI still in bull mode.
Exits from bull mode are defined by CCI dropping back below the threshold used for entry, not by price action alone. That keeps the framework internally consistent: the indicator that defined the entry also defines when the premise has changed.
Which Level to Trade
Market Condition Decides
Zero-line crosses are most useful when the market is already trending and price rarely crosses its average without follow-through. When a trend is already established, a CCI cross above zero after a pullback is meaningful because the context does the heavy lifting. The +100 cross is more appropriate when a trader wants to trade only confirmed breakouts and can tolerate later entries. In a clear sideways market, neither level produces reliable signals without an additional trend filter.
Lookback Period Effects
The period setting changes the signal frequency significantly. A 10-period CCI is more volatile with a smaller percentage of values between +100 and -100, making every level less stable and more prone to false crosses.1 A 40-period CCI has a higher percentage of values inside the band, making +100 a rarer and arguably more meaningful event.1
The default 20-period setting suits intermediate-term signals. For longer-term signals, chartists should use weekly or monthly charts rather than simply shortening or lengthening the period on a daily chart.1
Combining CCI With Non-Momentum Indicators
CCI should be used in conjunction with other indicators or price analysis, not in isolation.1 A second momentum oscillator is redundant. Volume-based tools such as On Balance Volume or the Accumulation Distribution Line add different information to CCI signals.1 Volume tools tell you whether the price movement being flagged by CCI is backed by real participation, which is a different question than the one CCI answers.
Price structure confirmation, such as a support break or a resistance break, is a practical complement to any CCI crossover rule. If CCI crosses +100 at the same time price clears a well-defined resistance level, both conditions reinforce each other.
Making a Crossover Rule Less Fragile
CCI Has No Upper Bound
CCI is an unbound oscillator with no theoretical upside or downside limit.1 Any fixed threshold rule must account for readings running well beyond +100 in a strong move. Securities can continue moving higher after CCI becomes overbought, just as they can keep falling after it becomes oversold.1 Treating +100 as an exit signal in a strong trend can cut winners short. The level signals the start of unusual strength, not a ceiling.
Extreme Levels as Additional Filters
More extreme levels such as +200 are harder to reach and more representative of a true extreme than +100.1 One approach waits for CCI to reach +200 and then exits when CCI crosses back below +200, rather than exiting on any dip below +100. It is important to wait for these crosses to reduce whipsaws should the trend extend, though such a system is not foolproof.1
The appropriate level also depends on the volatility of the underlying security. The CCI range for an index ETF such as SPY will typically be smaller than for most individual stocks.1 A level that represents a genuine extreme for one instrument may be routine for another.
Trend Filters and Scan Logic
One documented scanning approach places stocks in an uptrend first, requiring price above their 200-day moving average, then looks for CCI crossing above a threshold from oversold levels.1 Combining a trend filter with a CCI crossover rule reduces the universe of signals and focuses entries in the direction of the dominant move. The result is a smaller number of setups, each with a clearer directional case behind it.
- Stocks in an uptrend (price above 200-day SMA)
- CCI crossing above -200 from oversold (bullish recovery scan)
- Volume confirmation from On Balance Volume or Accumulation Distribution Line
- Price structure confirmation: resistance cleared or prior swing high broken
Automating a Bullish CCI Crossover
From Alert to Webhook
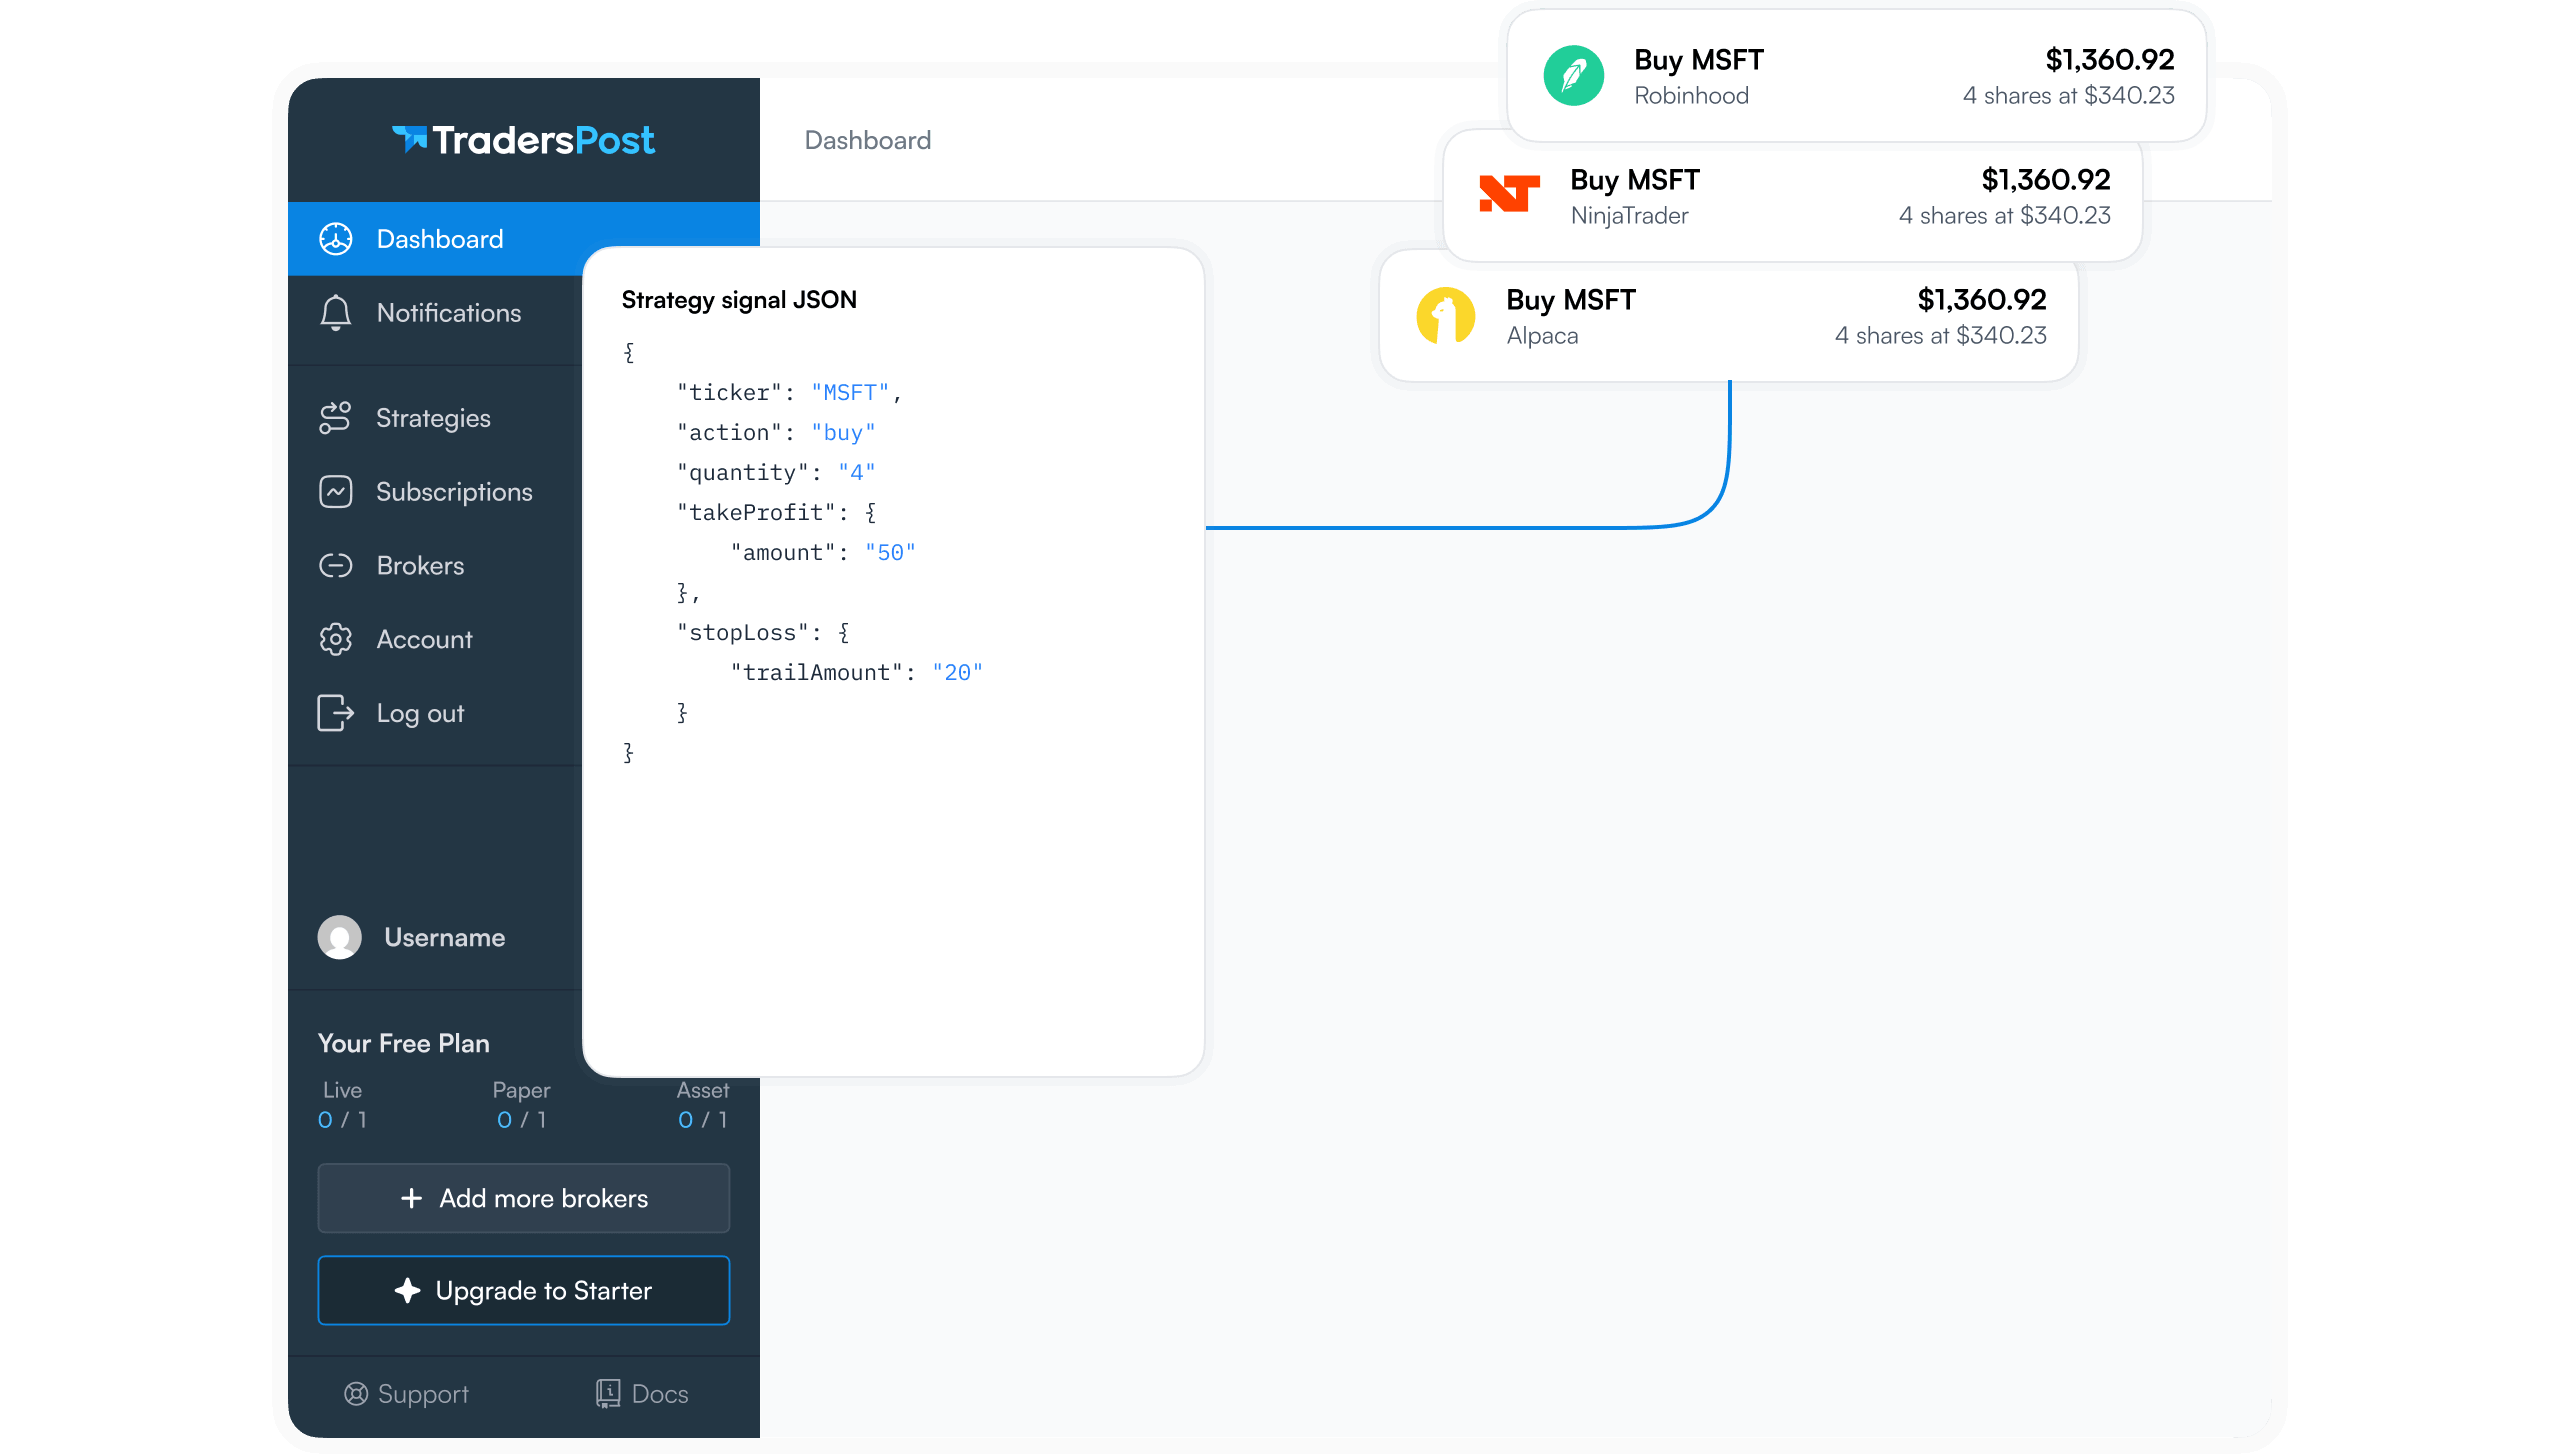
A CCI crossover rule coded in Pine Script fires an alert when the condition is met. That alert message is formatted as a JSON webhook payload and sent to a receiving endpoint. The payload must include at minimum a ticker field and an action field to route an order. Setting action to buy tells the system to open a long position on the bullish signal.
TradersPost receives that webhook and routes the order to your connected broker. The action field in the payload, set to buy for a bullish CCI crossover, tells TradersPost which direction to trade, and the ticker field identifies the instrument.
Adding a Stop Loss to the Payload
A stop loss can be attached directly in the webhook payload. For a CCI-based entry where the exact fill price is not known in advance, a relative percent stop is practical because it is calculated from the actual entry price. Set StopLoss.percent to define the distance as a percentage from entry. The quantityType field can be set to risk_dollar_amount or risk_percent to size the position relative to the stop distance, but either option requires a stop loss to be present in the payload.
{
"ticker": "AAPL",
"action": "buy",
"price": "{{close}}",
"time": "{{timenow}}",
"stopLoss": {
"type": "stop",
"percent": 2
},
"quantityType": "risk_dollar_amount",
"quantity": 500
}
Testing Before Going Live
Setting the test field to true in the webhook payload processes the signal without sending an order to the broker, allowing the full routing logic to be verified end to end. Paper trading the strategy before live deployment confirms that the CCI crossover fires at the expected moment and that the order parameters arrive correctly. Only after that validation step does it make sense to switch to a live broker connection.
If you want to automate a CCI crossover strategy without writing your own broker integration, TradersPost handles the webhook routing, order submission, and position tracking so you can focus on refining the signal logic.
Bottom Line
- A bullish CCI crossover above zero signals that the typical price has moved above its lookback-period average. It is a trend-change cue that whipsaws frequently in sideways markets.1
- Crossing above +100 is the stronger signal because Lambert scaled CCI so roughly 70 to 80 percent of readings stay inside the -100 to +100 band, making a breach of +100 genuinely unusual.1
- CCI has no upper bound, so +100 marks the start of unusual strength, not a ceiling. Readings can and do run far higher in sustained moves.1
- Using a trend filter (price above the 200-day SMA) and a non-momentum confirmation tool such as On Balance Volume makes either crossover rule more robust.1
- Any crossover rule can be automated via a Pine Script alert and a JSON webhook payload that specifies the ticker, action, and a stop loss.
Frequently Asked Questions
What is a bullish CCI crossover?
A bullish CCI crossover is the CCI line rising through a defined level, most commonly zero or +100. At zero it means the typical price has moved above its lookback-period average. At +100 it means price is showing unusual strength relative to that average.1 The level you choose changes how often the signal fires and how often it misleads you.
Why does the zero-line CCI crossover produce so many false signals?
The zero line is crossed whenever the typical price moves above its moving average, which happens frequently in sideways markets. Lambert's own documentation notes that simple zero-line crossovers can result in many whipsaws, and requiring a move above +100 is the documented way to reduce them.1
Is a CCI reading above +100 an overbought warning?
Not necessarily. When used as a coincident indicator, CCI surging above +100 reflects strong price action that can signal the start of an uptrend, not an imminent reversal.1 CCI is unbound, so securities can continue rising well after CCI exceeds +100. More extreme levels such as +200 are more representative of conditions where a mean reversion becomes plausible.1
What period setting should I use for CCI?
The default 20-period setting suits intermediate-term signals on daily charts. A shorter period such as 10 makes CCI more volatile and pushes a larger share of readings outside the -100 to +100 band, weakening the significance of those levels. A longer period such as 40 keeps more values inside the band, making a +100 cross rarer and potentially more meaningful. For long-term signals, switch to weekly or monthly charts rather than simply adjusting the period on a daily chart.1
Should CCI be used alone to trade crossovers?
No. CCI should be used in conjunction with other indicators or price analysis.1 A second momentum oscillator adds little; volume-based tools such as On Balance Volume or the Accumulation Distribution Line provide different information that complements CCI signals.1 Price chart confirmation, such as a support or resistance break, is a practical second condition before acting on any crossover.
References
1 Commodity Channel Index (CCI) - ChartSchool, StockCharts.com