Quantifying MACD Histogram Divergence
Learn to turn MACD histogram divergence into a testable condition: pivot definition, pairing rules, normalisation, and avoiding lookahead bias in backtests.

Marketing

MACD histogram divergence is one of the most discussed concepts in technical analysis and one of the most loosely defined. The phrase typically means that price made a new extreme while the MACD histogram did not confirm it, but that description contains at least three hidden decisions that must be made explicit before the condition can be tested in code or evaluated honestly in a backtest.
The MACD histogram is the MACD line minus its signal line, not the MACD line itself.1 Divergence measured on the histogram and divergence measured on the MACD line are distinct observations, and conflating them produces inconsistent results. This article walks through every decision required to turn the verbal description into a rule that runs without lookahead bias and fails honestly when the market does not cooperate.
The five steps are: define a pivot, pair the pivots, define the comparison metric, enforce the confirmation bar offset, and apply a trend filter. Skip any one of them and the condition is either always true, always false, or dependent on a human reading the chart after the fact.
What You Are Actually Measuring
Histogram vs. MACD Line
The standard MACD calculation produces three series: the MACD line (12-day EMA minus 26-day EMA), the signal line (a 9-day EMA of the MACD line), and the histogram (MACD line minus signal line).1 The histogram is positive when the MACD line is above its signal line and negative when below.1 It does not measure momentum directly; it measures the rate at which the two moving averages are converging or diverging.
Because the histogram changes faster than the MACD line, divergence on the histogram appears earlier but carries more noise than divergence on the MACD line itself. Both are legitimate observations, but they are not the same observation. A coded rule must specify which series it is comparing to price before a single condition is written.
Why 'Lines Disagree' Is Not a Condition
A verbal description like "price makes a lower low but the histogram makes a higher low" sounds unambiguous until you try to code it. It actually contains three implicit decisions: how to detect a low in the first place, which low on price to pair with which low on the histogram, and what numeric threshold separates "higher" from "effectively equal." Each decision needs an explicit rule. Skipping any one of them produces a condition that a backtest engine cannot evaluate consistently.
Step 1: Define a Pivot
The Lookback Requirement
A pivot low is a bar whose value is lower than the n bars before it and the n bars after it. Both sides of the window must be evaluated before the pivot can be confirmed. The right-side bars have not yet closed when the candidate bar forms, so a pivot is never known on the bar where it occurs. It is known only after n additional bars have elapsed past the candidate.
This delay is structural, not a coding shortcut. It is the source of all confirmation lag in any divergence signal, and it sets the minimum lag any entry generated from that signal will carry.
Choosing n
A small n (1 or 2) generates many pivots, most of them noise. A large n (5 or more) generates fewer pivots with more lag before confirmation. The choice is a direct tradeoff between signal frequency and confirmation delay, and n must be set identically on both the price series and the histogram series. Whatever value you choose, document it explicitly alongside any performance figures: "divergence" means nothing without knowing the pivot window it was measured on.
Step 2: Pair the Pivots
Same-Bar vs. Nearest-Bar Pairing
Price pivots and histogram pivots rarely confirm on exactly the same bar. A pairing rule decides which price pivot corresponds to which histogram pivot. Same-bar pairing is the strictest option: both pivots must confirm within the same bar index. This reduces the number of pairs available but keeps every comparison unambiguous. Nearest-bar pairing matches each price pivot to the closest histogram pivot within a tolerance window, which produces more pairs but introduces a subjective parameter that must be documented and tested for sensitivity.
Storing the Last Valid Pair
Once a pair is established, both values must be stored in variables that update only when a new confirmed pivot arrives. This ensures the comparison is always between two discrete confirmed pivots, not between a confirmed pivot and whatever the histogram is reading on the current bar. Failure to store the prior pivot value is the second most common source of lookahead bias in divergence code, after the pivot detection lag itself.
Step 3: Define the Comparison
Raw Values vs. Slopes
Comparing raw pivot values works when pivot spacing is uniform, but divergence setups rarely produce evenly spaced pivots. A larger price move over more bars can produce a misleadingly large histogram change even if the rate of change is the same as a smaller move over fewer bars. Comparing slopes, defined as the change in value divided by the number of bars elapsed between pivots, normalises for uneven spacing and makes the comparison scale-independent within a single instrument. Slope comparison is the more robust choice for any rule that will run across different market regimes or timeframes.
Normalising Across Instruments
MACD values are denominated in the price units of the underlying instrument, so a histogram reading of 1.5 on a $20 stock and a reading of 1.5 on a $100 stock represent very different momentum magnitudes relative to price.1 Any absolute threshold on the histogram must be scaled before it applies consistently across instruments or volatility regimes. The Percentage Price Oscillator (PPO) expresses the same calculation as a percentage of price and sidesteps the cross-instrument comparison problem entirely when that is the goal.1
Step 4: Eliminate Lookahead Bias
The Confirmation Bar Rule
A signal generated on the bar where a pivot forms uses data from bars that have not yet closed at that point in real time. That is the definition of lookahead bias. The correct approach is to emit the signal on bar index pivot_bar + n + 1, which is the first bar after the right-side lookback window has fully closed. Any backtest that does not enforce this rule will show entries at prices that were unavailable when the signal would have been generated live.
Validating With Bar Index Checks
After coding the rule, print the bar index of each detected pivot alongside the bar index of the corresponding signal. The signal bar should always be at least n bars later than the pivot bar. If the two indices match, the pivot detection is pulling right-side data into the signal calculation and the backtest results are inflated by future information. Running the same code on a paper trading account before live deployment is a practical way to confirm that signal timing matches chart observations in real time.
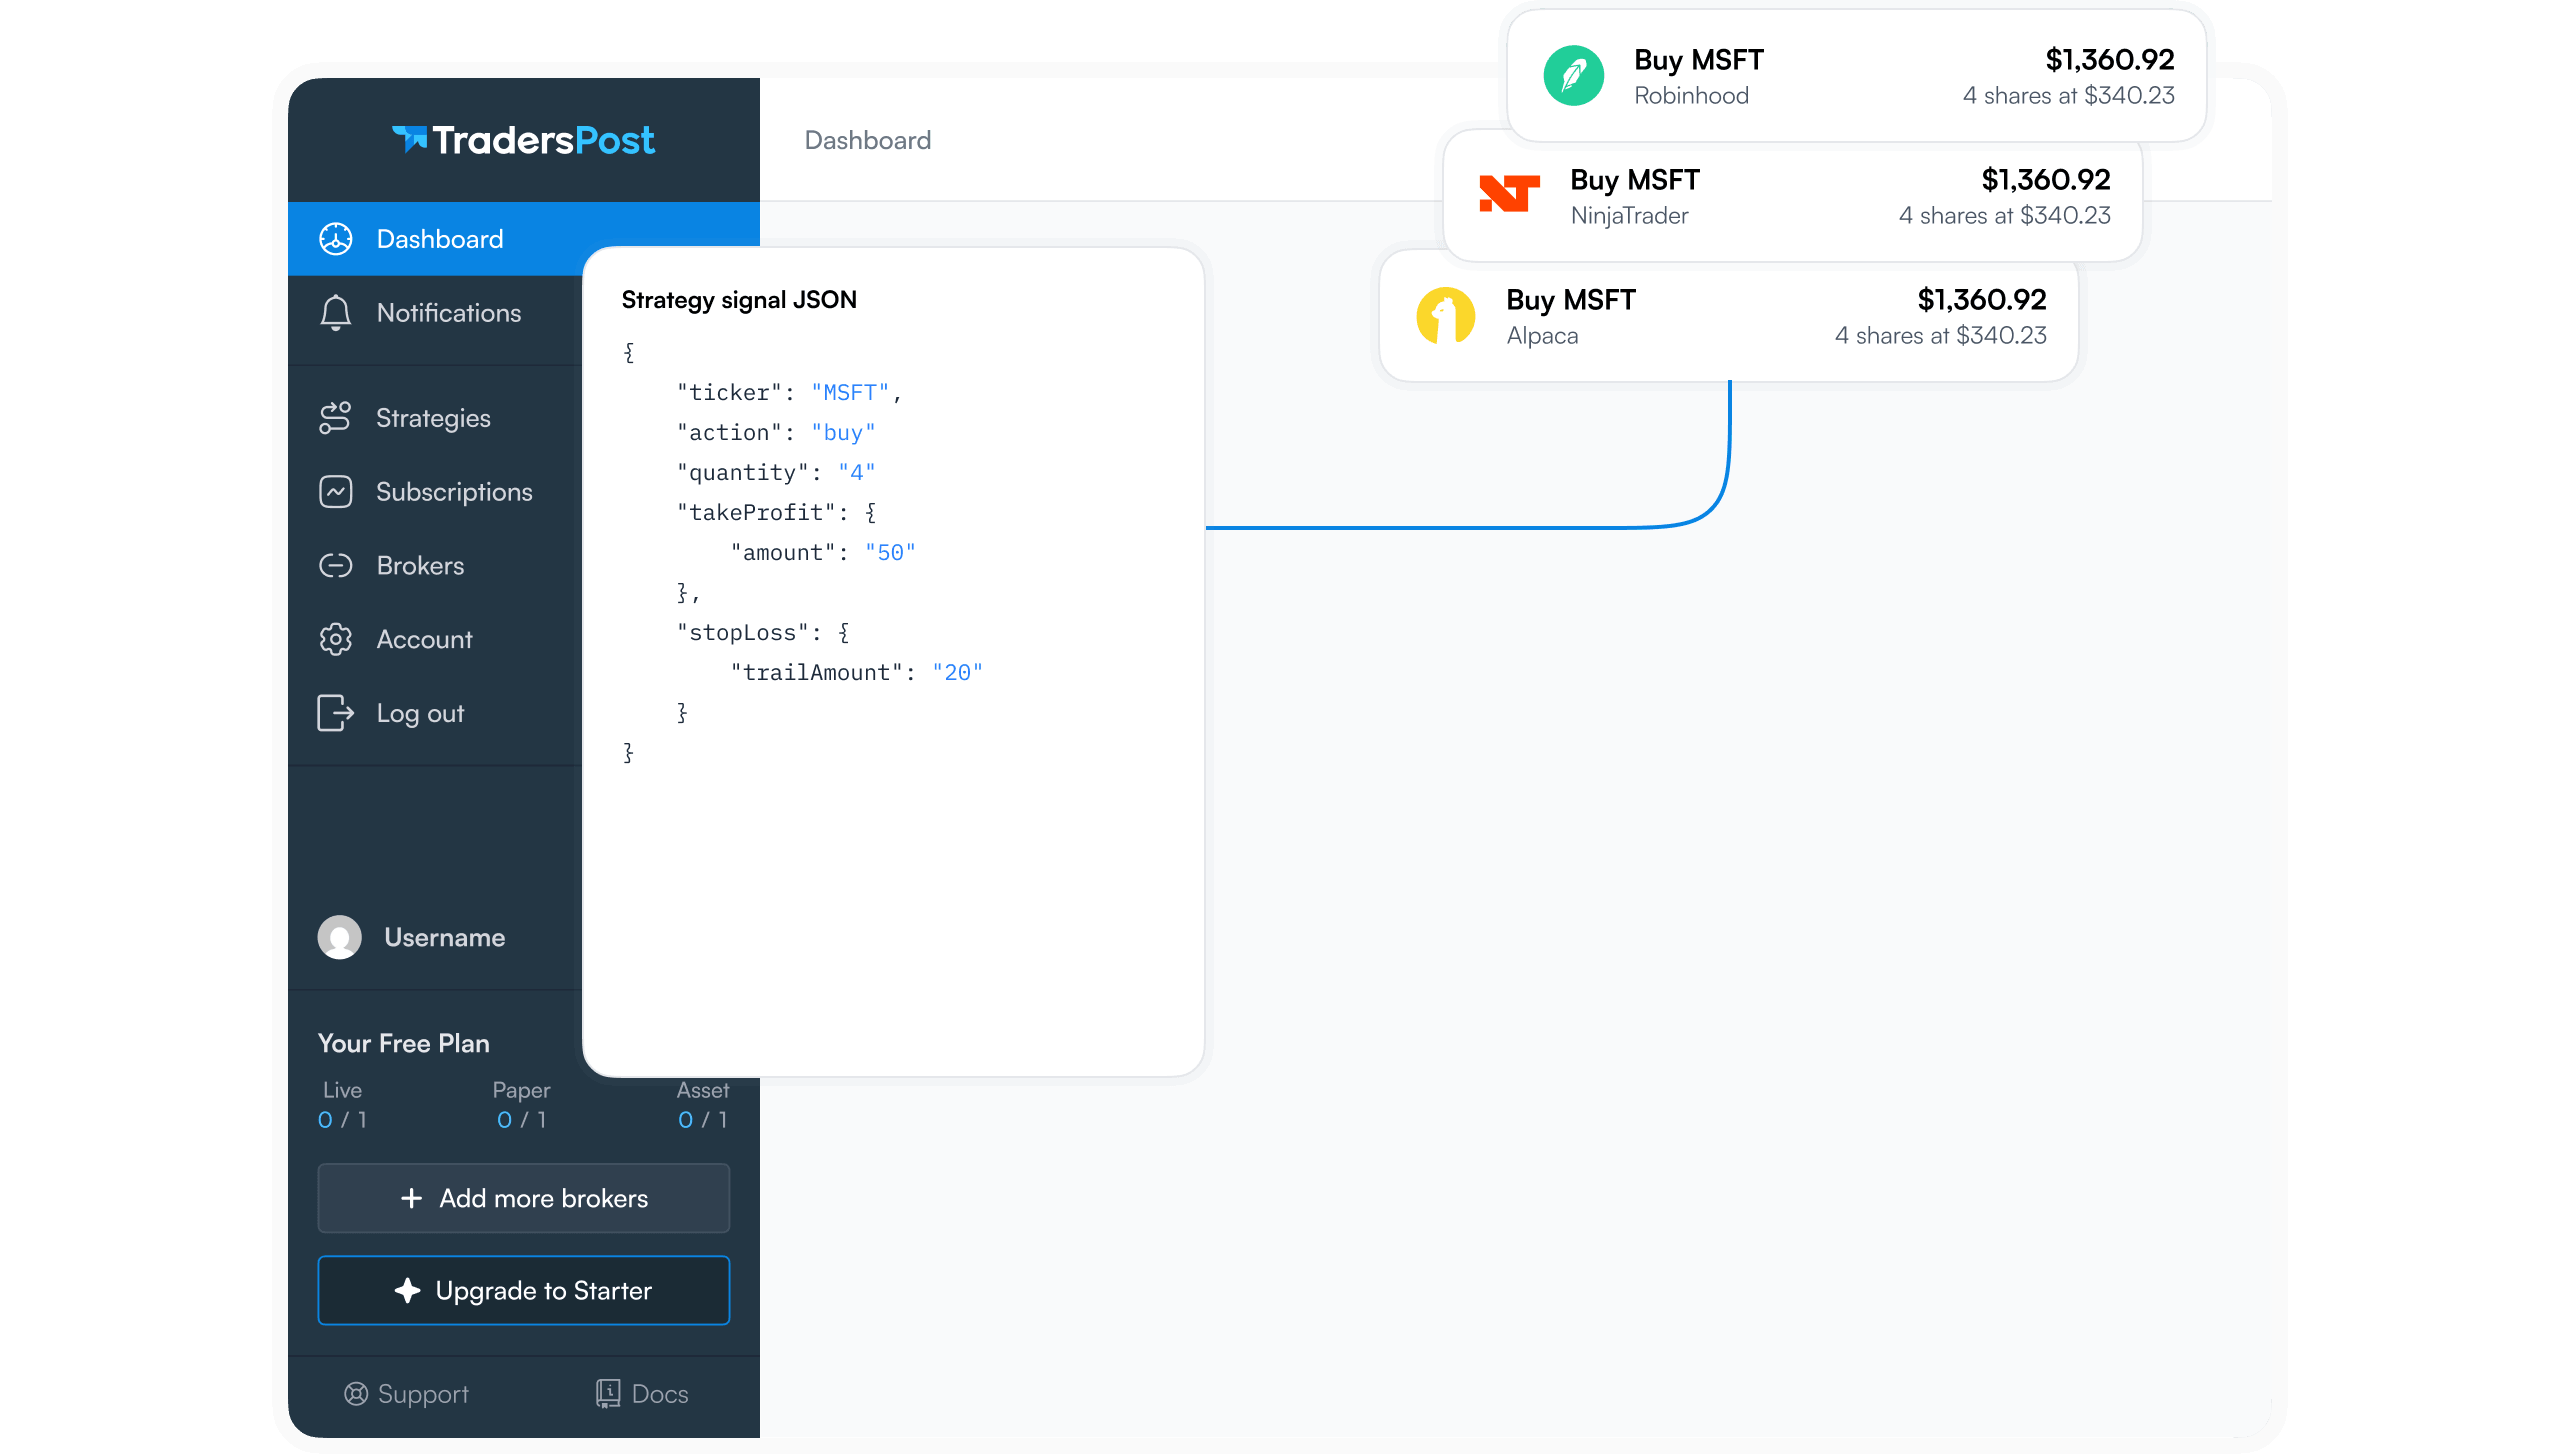
TradersPost paper accounts fill orders 24/7 and can be used to confirm that signal timing and order routing behave as expected before switching to a live broker connection.
Step 5: Expect Failure in Trends
Why Divergence Is Common in Uptrends
A strong uptrend typically begins with a large surge in upside momentum that sets a high histogram peak.1 Subsequent advances continue the trend at a slower pace, producing lower histogram highs against higher price highs. Bearish divergence is therefore structurally common inside a strong uptrend and does not by itself indicate a reversal.1 The histogram can remain positive through multiple bearish divergences, meaning upside momentum still outpaces downside momentum even as it fades.1
Adding a Trend Filter
A quantified divergence rule needs a condition that distinguishes a weakening trend from a reversing one. A straightforward approach is to require the MACD line to be near or crossing the zero line before treating the divergence as actionable. A centerline crossover occurs when the MACD line crosses zero, signaling that the shorter EMA has moved below the longer EMA.1 Requiring bullish divergence to occur while the MACD line is in negative territory, or bearish divergence to occur while it is in positive territory, filters out the majority of trend-continuation false signals without adding a free parameter.
- Bullish divergence filter: MACD line below zero at signal bar.
- Bearish divergence filter: MACD line above zero at signal bar.
- Optional tighter filter: require a signal line crossover following the divergence as additional confirmation, treating it as a separate event rather than part of the divergence definition.
Measure It Honestly
What to Track in a Backtest
Record the bar index of each pivot, the pairing rule used, the slope values compared, and the bar on which the signal fired. These four pieces of data allow post-hoc verification that no lookahead occurred and make it possible to reproduce every trade in the log. Count divergences that did not produce a reversal at the same rate you count those that did. The base rate of false signals in trending conditions is the key number that determines whether a trend filter improves the strategy or merely overfits to the sample.
A signal line crossover following a divergence has historically been treated as additional confirmation, not as the divergence itself.1 Conflating the two overstates the divergence hit rate in any performance summary.
Bottom Line
- Testable MACD histogram divergence requires four explicit decisions: pivot window size n, pairing rule, comparison metric (raw value or slope), and confirmation bar offset.
- The histogram's price-unit denomination means any absolute threshold needs normalisation before it generalises across instruments; the PPO resolves this for cross-instrument work.
- Bearish divergences during strong uptrends and bullish divergences during strong downtrends are structurally expected and should be filtered, not relied on as standalone signals.
- Honest measurement means counting failures at the same rate as successes and verifying signal bar timing before any live deployment.
- Every divergence signal carries at least n bars of inherent lag; factor that into entry timing expectations rather than trying to reduce it to zero.
Frequently Asked Questions
What is the difference between MACD divergence and MACD histogram divergence?
MACD divergence compares the MACD line itself to price. MACD histogram divergence compares the difference between the MACD line and its signal line to price.1 The histogram changes faster than the MACD line because it reflects the rate at which the two moving averages are converging or diverging, making histogram divergence an earlier but noisier signal. A coded rule must specify which series it uses; treating them interchangeably produces inconsistent backtest results.
Why can MACD values not be compared across different securities?
MACD is calculated as the raw difference between two EMAs, so its value is denominated in the price units of the underlying security.1 A histogram reading of 1.5 on a $20 stock and the same reading on a $100 stock reflect very different momentum magnitudes relative to price. The Percentage Price Oscillator expresses the same calculation as a percentage of price and allows valid cross-instrument momentum comparisons.1
How many bars does a confirmed pivot lag behind the bar where it formed?
A pivot defined with a right-side lookback of n bars is confirmed only after n additional bars have closed past the candidate bar. A signal fired on the pivot bar itself uses future price data and is lookahead-biased; the earliest valid signal bar is the pivot bar index plus n plus one. Every divergence signal carries at least n bars of inherent lag, which should be factored into entry timing expectations rather than ignored.
Why are bearish divergences common in strong uptrends?
Strong uptrends typically begin with a large momentum surge that sets a high histogram peak; subsequent bullish price moves continue at a slower pace, producing lower histogram highs.1 As long as the MACD line remains above zero, upside momentum still outpaces downside momentum even as the histogram fades, so the trend can persist through multiple bearish divergences.1 Treating every bearish divergence in a sustained uptrend as a reversal signal produces a high rate of false entries; a centerline condition reduces this rate measurably.
What is the minimum set of parameters needed to define a divergence rule in code?
Four parameters are required. First, pivot window size n, applied identically to both the price series and the histogram series. Second, a pairing rule specifying how a price pivot is matched to a histogram pivot, either same-bar or nearest-bar within a tolerance. Third, a comparison metric, either raw value difference or slope normalised for bar spacing. Fourth, a confirmation bar offset ensuring the signal fires after all right-side pivot bars have closed, specifically at pivot bar index plus n plus one.
References
1 StockCharts ChartSchool: MACD (Moving Average Convergence/Divergence) Oscillator