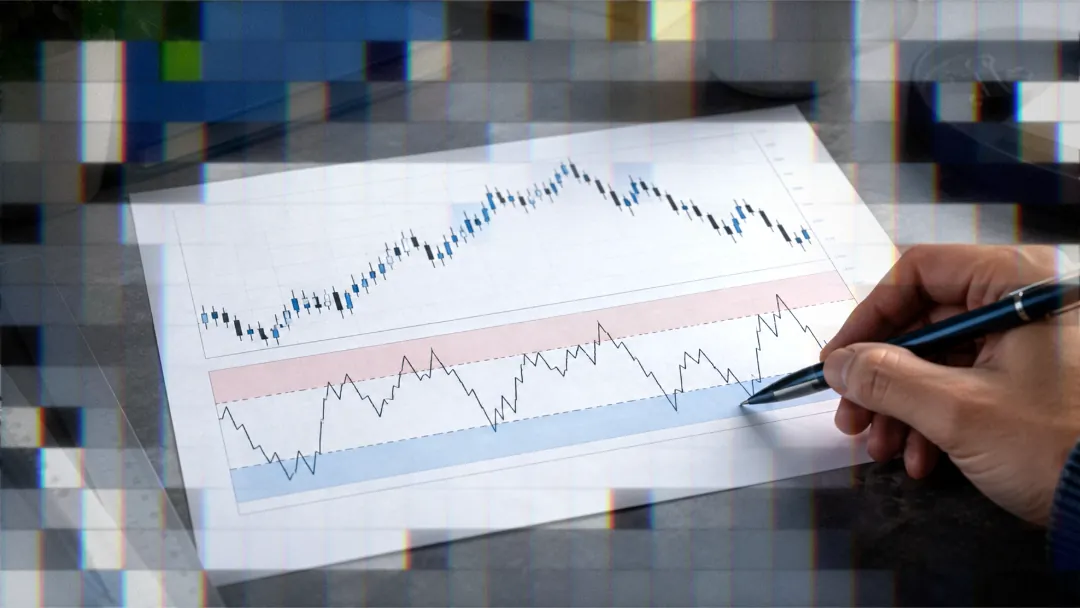
Williams %R Extreme Readings: What They Signal
Williams %R below -80 or above -20 describes price location, not value. Learn what extreme readings actually mean and when to act on them.

Marketing

Williams %R extreme readings are one of the most misread signals in technical analysis. A reading below -80 or above -20 tells you exactly where the close sits within the instrument's recent high-low range. It does not tell you whether the instrument is cheap, expensive, or due for a reversal. That distinction is not academic. Trading on the wrong interpretation of williams %r extreme readings is how trend-following setups turn into counter-trend losses.
The indicator was developed by Larry Williams and is mathematically identical to the Fast Stochastic Oscillator, with one difference: the scale runs from 0 to -100 instead of 0 to 100.1 Everything below works through what the extremes actually mean, when they are useful as trade triggers, and when following them will put you on the wrong side of a trend.
The sections that follow cover the formula, the oversold/overbought logic, why the same reading means opposite things depending on market regime, and how to build a Pine Script alert that routes signals to a broker automatically. Parameter choices are covered at the end.
What Williams %R Actually Measures
The Formula in Plain Terms
Williams %R divides the distance from the highest high to the close by the total high-low range, then multiplies by -100.1 The result always falls between 0 and -100, with -50 as the midpoint representing a close exactly in the middle of the period's range. A reading of -20 means the close is near the top of the look-back range; a reading of -80 means it is near the bottom.
For a concrete example: if the highest high is 110, the lowest low is 100, and the close is 108, the calculation is ((110 - 108) / (110 - 100)) x -100 = -20. If the close drops to 103, the result is -70.1
Location, Not Value
An extreme reading is a statement about where price closed within its recent range, not about whether the instrument is cheap or expensive. The indicator carries no information about whether the current range is high or low relative to longer history.1 Understanding this distinction prevents the most common misuse: treating -80 as automatic evidence that price is undervalued.
Default Parameters and Scaling
The default look-back is 14 periods, applicable to any timeframe: intraday, daily, weekly, or monthly.1 Because Williams %R and the Fast Stochastic Oscillator produce identical lines, any signal logic developed for one transfers to the other. The only functional difference is cosmetic: the inverted scale. Lengthening the look-back period, such as switching from 14 to 28 periods, makes the oscillator react more slowly to short-term swings and reduces signal frequency.1
Why Oversold Does Not Mean Buy
Sustained Selling Looks Like Oversold
Readings below -80 occur when price closes at the low end of its high-low range.1 That reflects sustained selling pressure rather than a reversal opportunity. Closing levels that are consistently near the bottom of the range confirm that sellers are in control. Treating -80 as a buy signal in a downtrend means trading against the dominant force the indicator is actually describing.
Readings Can Pin at Extremes
During a strong downtrend, Williams %R can remain below -80 for extended stretches without a meaningful reversal. Securities can become oversold and remain oversold during a strong downtrend.1 A reading that stays pinned at an extreme is not a malfunction. It is the indicator confirming that each successive close is landing near the bottom of its range, which is exactly what trend continuation looks like.
Overbought Extremes Follow the Same Logic
Above -20 Signals Closing Strength
Readings from 0 to -20 indicate that price is closing near the top of its look-back range. In a strong uptrend, the oscillator can remain above -20 for many consecutive periods without a pullback materializing. Closing levels that are consistently near the top of the range indicate sustained buying pressure, not an imminent reversal.1 The same logic that makes -80 unreliable as a buy trigger makes -20 unreliable as an automatic sell signal.
Momentum Failure at the Extremes
Where overbought readings do produce actionable signals is when momentum begins to fail. The failure to move back into overbought or oversold territory signals a change in momentum that can foreshadow a significant price move.1 If %R makes multiple runs above -20 and then a subsequent rally falls short of that level, the inability to reach the extreme shows that buying pressure is fading. A subsequent decline below -50 after this failure confirms the downturn and can precede a sharper price drop.1
The Same Reading Means Two Different Things
Mean Reversion in Ranging Markets
When price is oscillating within a defined range, a drop below -80 followed by a move back above -50 is a usable mean-reversion signal. The -50 centerline functions as a confirmation gate: a move above -50 after an oversold reading confirms an upturn; a move below -50 after an overbought reading confirms a downturn.1 Waiting for the -50 cross rather than acting at the extreme reduces false entries in ranging conditions.
Trend Continuation in Trending Markets
In a trending market, the same oversold reading that works as a buy trigger in ranging conditions can mark the beginning of a sustained move lower. Fading an extreme during a strong trend means entering against the very pressure the indicator is measuring. Whether an extreme should be faded or followed depends entirely on the market regime, not on the reading itself. Without a method for identifying the regime, the extremes produce signals in both directions without any basis for choosing between them.
Regime Filters: Deciding What to Do
Using a Moving Average as a Regime Filter
A long-term moving average separates trending from ranging environments before applying Williams %R signals. One practical approach: scan for stocks trading above their 200-day moving average that show oversold %R readings as pullback-in-uptrend entries, and scan for stocks below the 200-day moving average that show overbought readings as bounce-in-downtrend entries.1 This uses trend context to determine whether an extreme reading should prompt a trade in the direction of the trend or a fade.
The -50 Centerline as Confirmation
Williams %R crossing above -50 signals that price is in the upper half of its recent range, consistent with an uptrend bias. Think of -50 as the 50-yard line: the offense has a higher chance of scoring when it crosses midfield.1 Waiting for a -50 cross after an extreme reading filters out shallow bounces and confirms that momentum has actually shifted. Without this confirmation mechanism, extremes produce too many signals in both directions.
Trend Estimation with Longer Periods
A 125-period Williams %R covers roughly six months of daily data and can serve as a trend gauge.1 When the 125-period %R is above -50, prices are above their approximate six-month average, consistent with an uptrend. Readings below -50 on a long-period %R are consistent with a downtrend and shift the interpretation of shorter-period extreme readings: oversold becomes trend confirmation rather than a reversal trigger.
Combining %R with Other Signals
Volume and Chart Patterns
Volume, chart patterns, and breakouts can confirm or refute signals produced by Williams %R.1 An oversold reading accompanied by declining volume on down bars is a different situation from one accompanied by climactic selling volume. Using %R alongside a breakout pattern adds structural evidence that a move is real rather than a noise-driven oscillation. The indicator generates the alert; price structure and volume determine whether it is worth taking.
Adding a Signal Line
A short moving average applied to %R itself, such as a 3-period SMA, acts as a signal line and smooths out single-bar noise.1 A cross of %R above its signal line after an oversold reading is a more deliberate entry trigger than the raw oscillator crossing -80. This approach mirrors how MACD uses its signal line: the cross generates the trade, not the level. The signal line introduces a one-to-two bar lag but cuts down on entries triggered by single-candle spikes that immediately reverse.
Automating Williams %R Alerts
Writing the Alert Condition in Pine Script
Williams %R can be calculated in Pine Script using the built-in ta.wpr() function, and an alertcondition() can fire when the value crosses -80, -50, or -20. A regime-filtered alert might require both that %R crosses above -50 and that price is above a moving average before sending a signal. Separating the indicator logic from the alert condition keeps the script readable and makes it easier to adjust thresholds without rewriting entry conditions.
A basic example for a bullish regime-filtered signal:
//@version=5
indicator("Williams %R Alert", overlay=false)
length = input.int(14, "Length")
maLength = input.int(200, "MA Length")
wr = ta.wpr(length)
ma = ta.sma(close, maLength)
bullishSignal = wr[1] < -50 and wr >= -50 and close > ma
alertcondition(bullishSignal, title="WR Cross Above -50 in Uptrend", message='{"ticker":"{{ticker}}","action":"buy","sentiment":"bullish","price":"{{close}}","time":"{{timenow}}"}')
plot(wr, "Williams %R", color=color.blue)
hline(-20, "-20", color=color.red)
hline(-50, "-50", color=color.gray)
hline(-80, "-80", color=color.green)
Routing Alerts to a Broker via Webhook
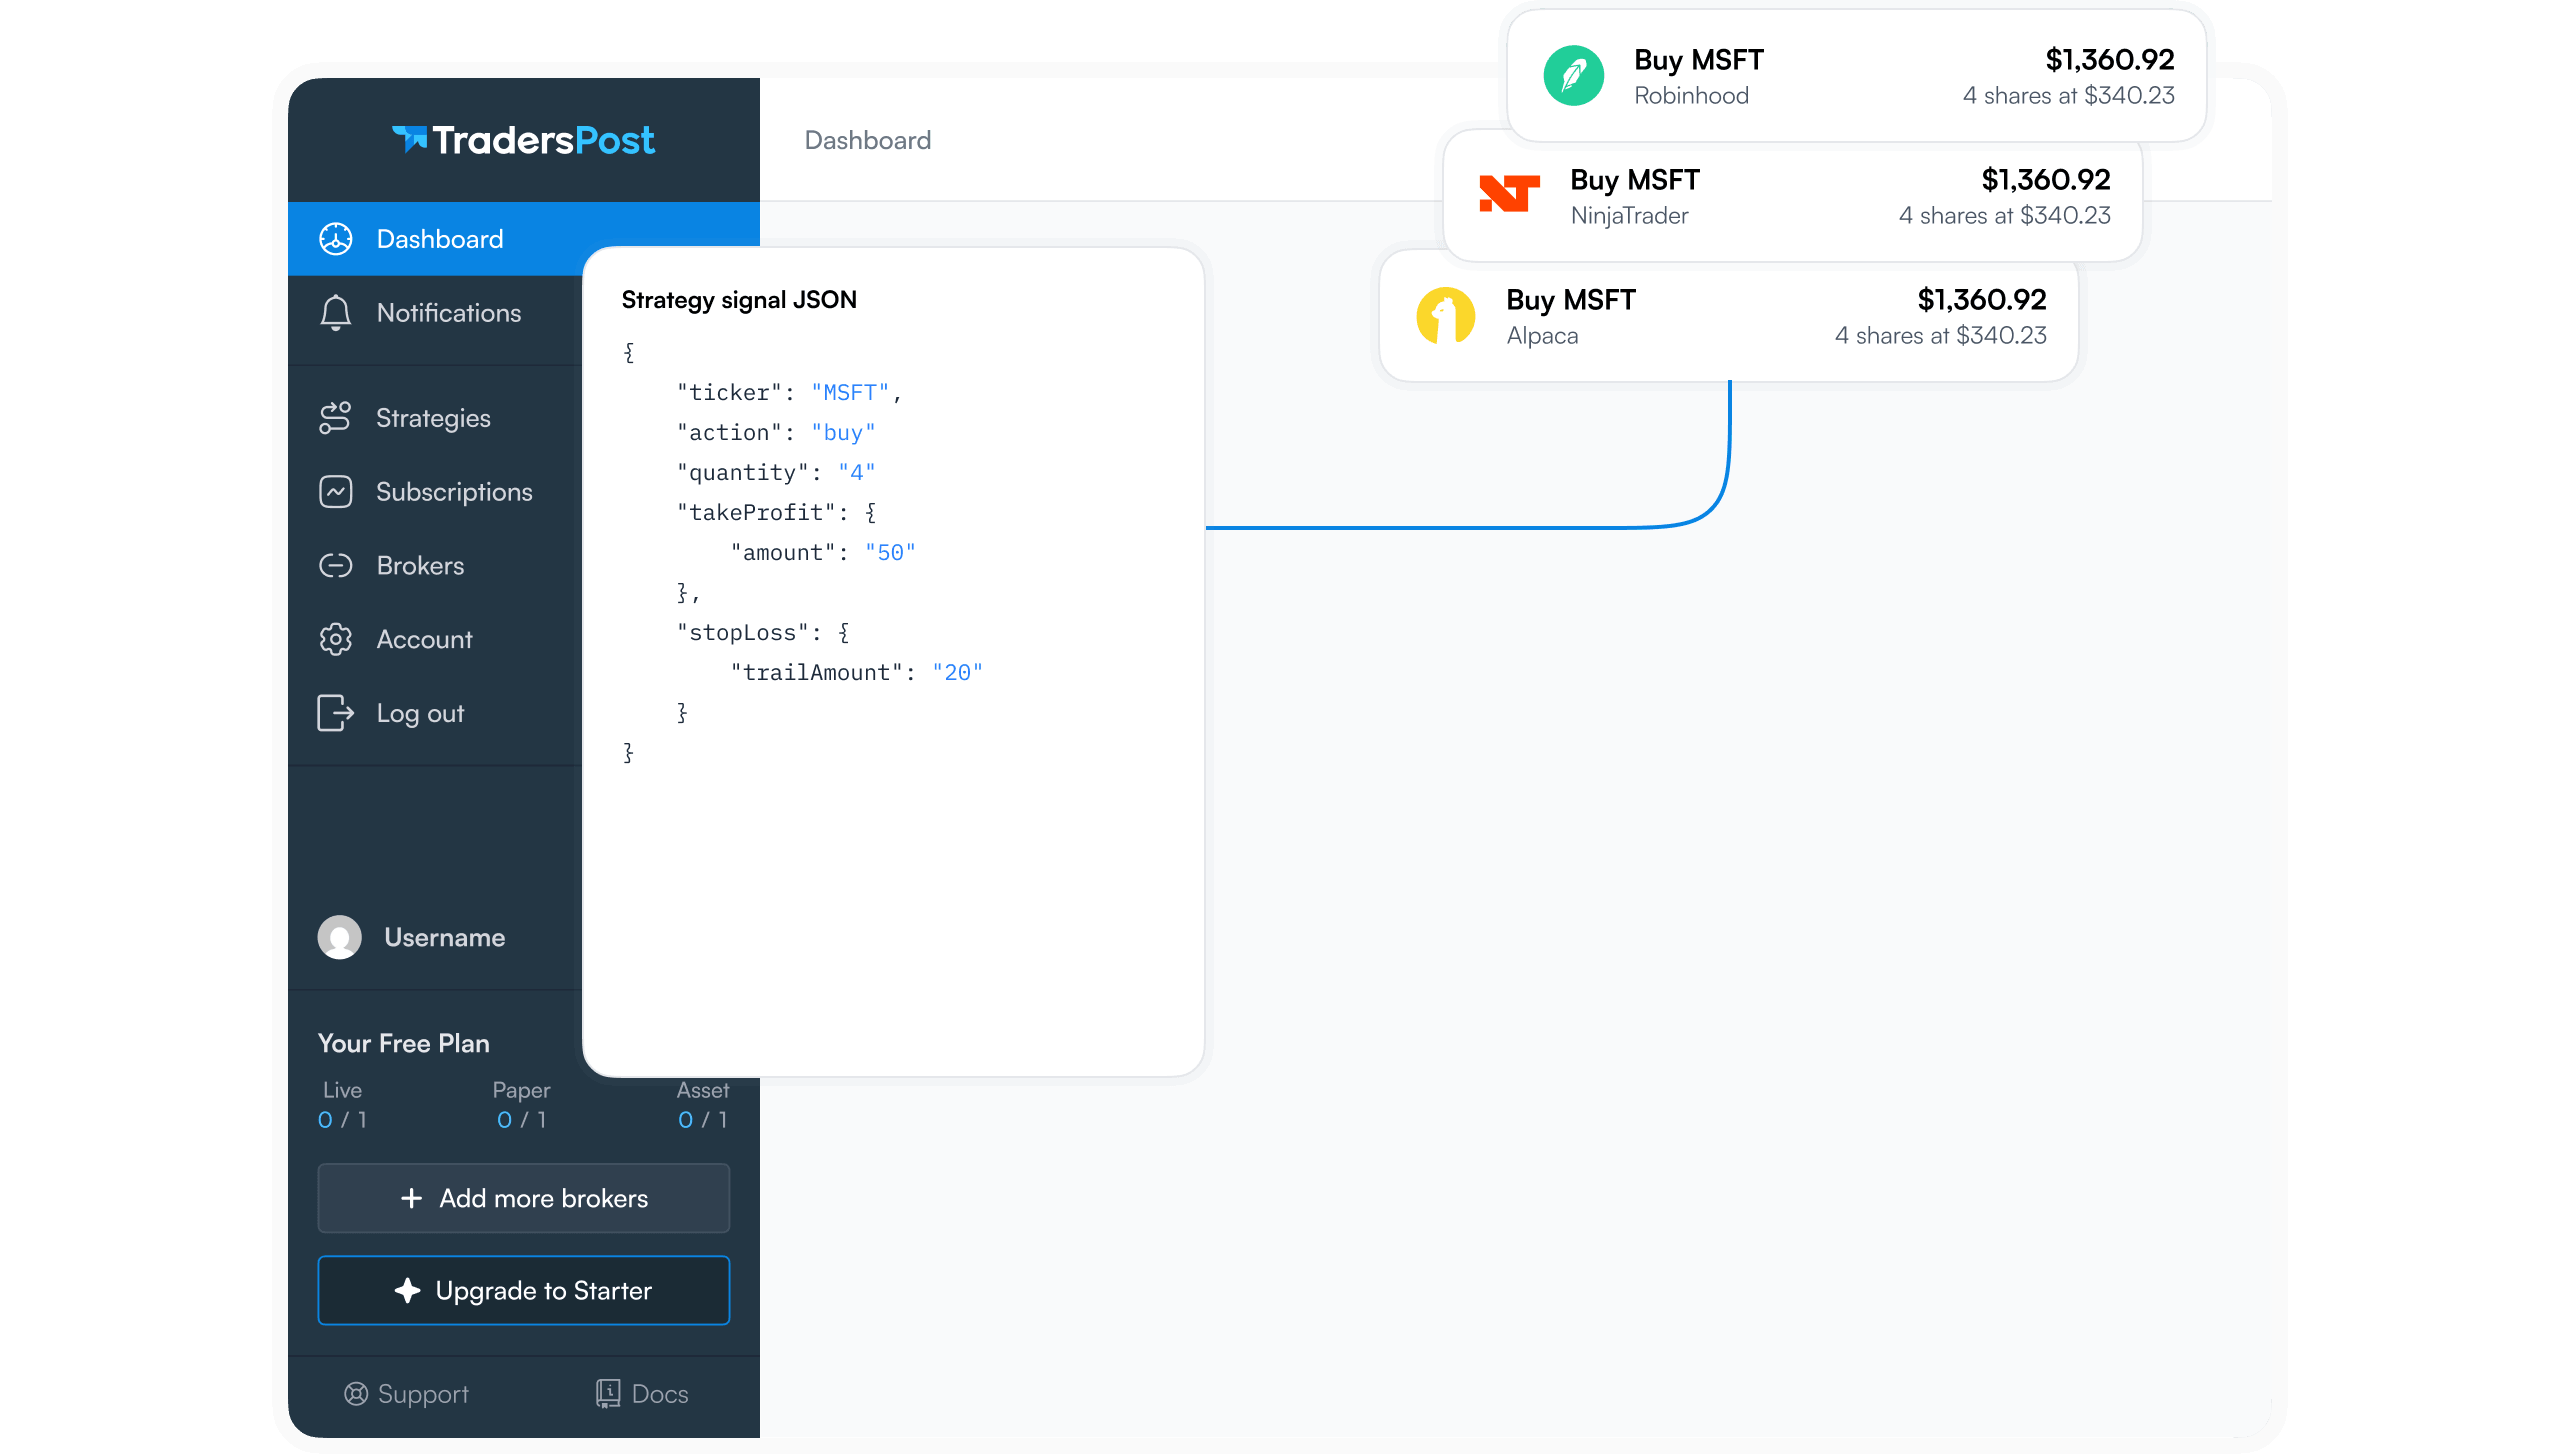
Once an alertcondition fires in TradingView, the alert message can include a JSON payload with ticker, action, price, and sentiment fields sent to a webhook URL. TradersPost receives that webhook payload and routes the signal to a connected broker, executing the order according to the strategy subscription settings. Including the sentiment field in the payload tells the system the intended position state after execution, which prevents conflicting orders when the indicator flips quickly between extremes.
A minimal payload for a regime-filtered long entry looks like this:
{
    "ticker": "{{ticker}}",
    "action": "buy",
    "sentiment": "bullish",
    "price": "{{close}}",
    "time": "{{timenow}}"
}
Once your signals are routing correctly in paper mode and the fill logs match your expected entry logic, you can point the same webhook at a live broker subscription without changing the Pine Script or the payload structure.
Choosing the Right Look-Back Period
Shorter Periods Increase Sensitivity
A shorter look-back makes the oscillator more reactive, generating more frequent crossings of the -80 and -20 thresholds. Higher sensitivity can be useful on faster timeframes but increases the rate of false signals in noisy conditions. The tradeoff is between responsiveness and reliability: shorter periods catch moves earlier but with lower confirmation quality. A 7-period %R on a 5-minute chart will fire alerts constantly; most will not lead anywhere.
Longer Periods Suit Swing Contexts
A 28-period Williams %R produces a smoother oscillator that takes longer to reach the extremes and holds there longer.1 Swing traders and position traders often prefer longer settings because they reduce whipsaw and align better with multi-day moves. The look-back period should match the holding period of the strategy: a day-trade setup and a swing setup require different parameter choices. Using a 14-period setting on a weekly chart produces signals with roughly the same tempo as a 28-period setting on a daily chart, so timeframe and period interact directly.
Bottom Line
- Williams %R measures where price closed within its recent range. A reading of -80 means the close is near the bottom of the 14-period high-low range. It says nothing about whether the instrument is undervalued.
- Extreme readings can persist for many bars during a strong trend. Persistence is confirmation of the trend, not a malfunction of the indicator.
- The -50 centerline is the most reliable confirmation tool. Waiting for a cross of -50 after an extreme reading filters shallow bounces and confirms that momentum has shifted.
- A regime filter, such as the 200-day moving average or a 125-period %R above or below -50, determines whether an extreme should be faded (ranging) or followed (trending).
- Automating the strategy requires matching the look-back period and thresholds to the timeframe and holding period of the setup, then building confirmation logic into the alert condition rather than acting on the raw extreme.
Frequently Asked Questions
What does a Williams %R reading of -80 actually mean?
A reading below -80 means the close is near the lowest low of the look-back period, indicating price is at the low end of its recent range.1 It does not indicate that the instrument is undervalued or that a reversal is imminent. In a downtrend, readings can stay below -80 for many periods in a row without any meaningful bounce occurring.
How is Williams %R different from the Stochastic Oscillator?
Williams %R and the Fast Stochastic Oscillator produce identical lines but with different scales: %R runs from 0 to -100 while the Stochastic runs from 0 to 100.1 Williams %R measures the close relative to the highest high; the Stochastic measures the close relative to the lowest low. The -100 multiplier in the %R formula corrects for the inversion, making the two indicators mathematically equivalent despite the different framing.
Why does Williams %R give false signals in trending markets?
In a strong trend, the oscillator reaches an extreme and stays there because each close continues to land near the same end of the range. A trader who fades every oversold or overbought reading is fighting the trend that the indicator is confirming.1 A regime filter, such as a long-term moving average, is needed to separate trending from ranging conditions before the extremes can be used as mean-reversion triggers.
What is a momentum failure in Williams %R?
A momentum failure occurs when %R previously reached overbought territory repeatedly but then a subsequent rally fails to push back above -20. The inability to re-enter overbought territory shows that buying pressure is weakening even if price has not yet broken down visibly.1 A subsequent decline below -50 after this failure confirms the downturn in momentum and can precede a sharper price drop.
Should I adjust the -20 and -80 thresholds for different instruments?
The default thresholds of -20 and -80 can be adjusted to suit the characteristics of a specific security or timeframe.1 A more volatile instrument might rarely touch -20 or -80 with default settings, making a threshold adjustment necessary to generate usable signals. Any adjustment should be validated against historical behavior of that specific instrument rather than applied universally.