Walk-Forward Optimization Trading Guide
Master walk-forward optimization trading to test strategies across market regimes, reduce curve fitting, and prepare alerts for disciplined automation.

Marketing

Bottom Line
- Walk-forward optimization divides historical data into in-sample and out-of-sample windows, optimizing strategy parameters on the former and testing them on the latter without changes.
- The process involves optimizing a strategy on a prior period, validating it on a subsequent period, and repeating this cycle to cover the entire historical dataset.
- Traders should be cautious of large performance decay from in-sample to out-of-sample results, as it may indicate overfitting.
- Walk-forward optimization helps evaluate strategy performance across different market regimes, such as bull trends, bear trends, and volatile selloffs.
- The method provides a framework for deciding whether to automate a strategy, emphasizing stable out-of-sample performance over impressive in-sample results.
A trading strategy that looks flawless in a backtest can still fail the moment real capital is at risk. The usual culprit is not necessarily a bad idea, but an overfit one: parameters tuned so tightly to historical noise that they cannot adapt when volatility, trends, liquidity, or correlations shift. Walk forward optimization trading addresses that problem by repeatedly optimizing a strategy on one period of data, then testing it on the next unseen period.
This guide explains how to build a practical walk-forward process that evaluates strategies across multiple market regimes rather than relying on a single in-sample backtest. You will learn how to divide data into training and validation windows, choose sensible parameter ranges, interpret out-of-sample results, and identify when strong historical performance is actually a curve-fitting warning sign. We will also cover how to turn validated rules into disciplined alerts and automation-ready execution logic.
The objective is not to find a perfect parameter set. It is to develop a strategy with evidence of robustness, realistic expectations, and a testing framework that remains useful as markets evolve.
What Is Walk-Forward Optimization in Trading?
In-Sample and Out-of-Sample Windows
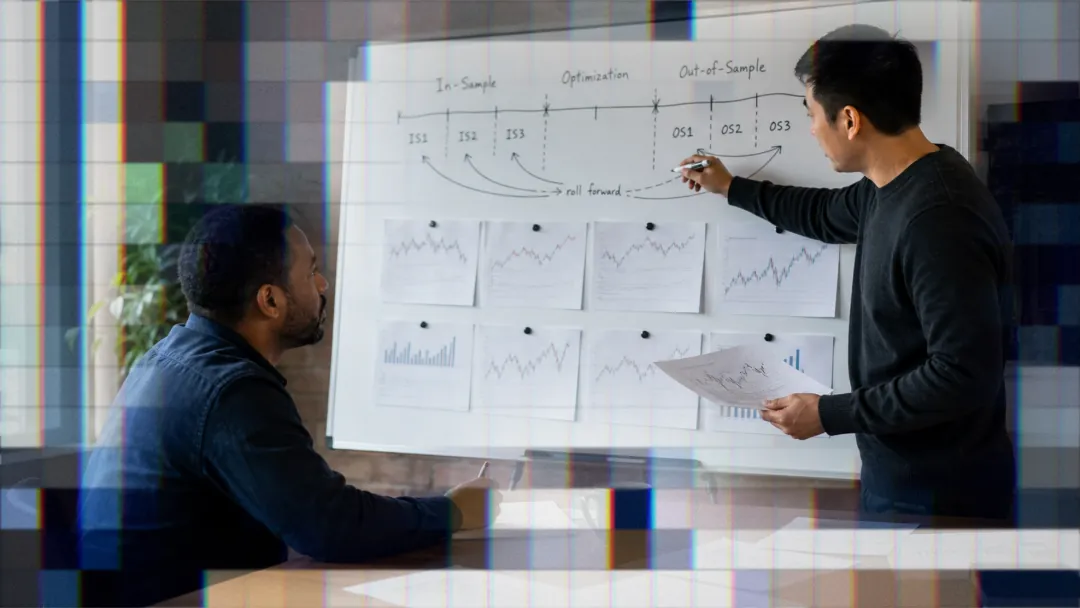
Walk-forward optimization divides historical price data into a sequence of time windows instead of treating the entire history as one static backtest. Each sequence contains an in-sample window, followed immediately by an out-of-sample window.
The in-sample window is the period used to optimize a deliberately limited set of strategy parameters. For an automated trend-following strategy, those parameters might include moving-average lengths, an ATR stop multiplier, or the lookback period used to calculate a breakout. The objective is to identify settings that meet predefined performance and risk criteria within that training period.
The out-of-sample window is subsequent, unseen data. After selecting parameters in the in-sample period, the strategy trades the out-of-sample period using those exact settings. No parameter changes are permitted during this validation segment.1 This tests whether the selected settings retain reasonable effectiveness beyond the data used to select them.
The goal is not to locate the parameter combination with the highest historical return. A setting that produces an exceptional in-sample result may simply be fitted to random price behavior. More credible candidates perform acceptably across unseen periods, with risk, drawdown, and trade frequency that remain consistent with the strategy’s intended design.
How the Walk-Forward Sequence Works
A walk-forward test follows a repeatable cycle:
- Optimize the strategy on the first in-sample window.
- Select parameters using predefined criteria, such as net profit, maximum drawdown, profit factor, or a minimum number of trades.
- Apply those fixed parameters to the immediately following out-of-sample window.
- Record the out-of-sample trades and performance without re-optimizing during that validation period.
- Move both windows forward in time and repeat the process until the available history is exhausted.
For example, a trader might optimize a strategy on the prior 12 months of data, validate it over the next three months, then advance the test by three months. Every validation block represents a decision that could have been made using only information available at that point in history.
The key output is created by stitching every out-of-sample segment into one continuous equity curve. This stitched out-of-sample curve, rather than the optimized in-sample results, is the central evidence for assessing whether a strategy may be robust instead of curve-fit.
Why Walk-Forward Analysis Is More Realistic Than One Backtest
In a conventional one-period backtest, the same historical data can influence both strategy design and final evaluation. Even when a trader does not intentionally overfit, repeated adjustment of entries, exits, filters, and risk controls can make the final result depend heavily on knowledge of the test period.
Walk-forward analysis introduces sequential out-of-sample validation, which better reflects the operational reality of automated trading. Markets change through persistent trends, volatile reversals, low-volatility ranges, liquidity shifts, and changing correlations. A parameter set that works during one regime may fail when those conditions change.
Walk-forward optimization does not prove that a strategy will be profitable in the future. It can, however, expose fragile parameter choices before real capital is committed. Traders should be especially cautious when stitched out-of-sample performance is materially weaker than in-sample performance, when only a narrow parameter range works, or when results depend on a small number of trades.
For further background, see QuantInsti’s introduction to walk-forward optimization.
Why Traders Use Walk-Forward Optimization
Reduce the Risk of Curve Fitting
Walk-forward optimization helps separate a strategy with a repeatable edge from one that has merely been fitted to historical noise. Curve fitting occurs when rules, thresholds, or indicator settings are tailored so closely to one past sample that the backtest looks exceptional, but the same settings fail when market conditions change.
For example, a trader might test dozens of fast and slow moving-average combinations on a single five-year period, then select the pair that produces the highest net return. That winning combination may have benefited from a handful of unusually well-timed entries during that exact period. It is not necessarily the combination most likely to perform in the next year.
A walk-forward process repeatedly optimizes parameters on an earlier segment of data, then evaluates the selected parameters on a later, untouched segment. Review the gap between in-sample and out-of-sample results. A parameter set that earns slightly less during optimization but produces steadier out-of-sample returns, similar trade frequency, and smaller performance degradation is generally more credible than the single best in-sample result.
- Prefer parameter neighborhoods over isolated winners: if settings around a selected value also perform reasonably well, the result is less likely to depend on a coincidence.
- Watch for large in-sample to out-of-sample decay: a strategy that gains 40% in optimization but loses money in most forward tests is likely overfit.
- Keep the rule set stable: avoid adding a new filter solely because it improves one historical segment.
Test Performance Across Market Regimes
A strategy should be evaluated in the market environments it is likely to encounter after deployment. Relevant regimes include sustained bull trends, bear trends, high-volatility selloffs, low-volatility ranges, and sharp reversals. A trend-following system optimized during a strong uptrend may appear highly reliable because pullbacks are brief and breakouts persist. The same system may generate repeated whipsaws in a low-volatility range or take larger losses when a bear-market rally reverses abruptly.
Choose a historical sample long enough to include multiple regimes that matter for the instrument and timeframe being traded. A daily strategy on broad equity indexes may require more than one market cycle. An intraday futures strategy should include calm sessions, event-driven volatility, opening reversals, and periods with persistent directional movement.
Label major periods during the review. For each walk-forward segment, note whether conditions were trending, ranging, volatile, or reversing. Then identify where the strategy underperformed and why. For example, a moving-average breakout model may perform well in sustained trends but suffer clustered small losses during low-volatility consolidation. That observation is more useful than an aggregate return alone because it identifies the specific conditions that create risk.
Create Evidence for an Automation Decision
Walk-forward results provide a decision framework before converting strategy signals into automated trade alerts. The objective is not to find a perfect equity curve. It is to determine whether the strategy behaves consistently enough across independent periods to justify further operational testing.
Give more weight to a stable out-of-sample equity curve, controlled drawdowns, and consistent trade behavior than to one impressive backtest statistic. Review whether trade count remains plausible, whether losses cluster during identifiable regimes, and whether position sizing assumptions remain realistic. A strategy with moderate but repeatable out-of-sample returns is usually a stronger automation candidate than one with a high headline return driven by a few exceptional trades.
Walk-forward testing is still not a substitute for Paper trading. Historical simulations cannot fully reproduce live alert timing, order behavior, spreads, fills, or changing market conditions. After the walk-forward review, paper trade the signals and compare actual alert and order behavior with the assumptions used in testing.2 Only then can a trader assess whether the strategy’s historical evidence remains relevant to an automated execution workflow.
How to Set Up a Walk-Forward Optimization Test
Choose the strategy rules before choosing parameters
Define the trading hypothesis first, then identify which inputs can reasonably vary. A walk-forward test should answer whether a stable idea continues to work under changing conditions, not whether historical data can be fitted with enough adjustments.
For example, a trend-continuation strategy might enter when price closes above a 20-day breakout level and exit on a protective stop or profit target. The breakout concept and direction filter are fixed rules. The adjustable parameters could include the breakout lookback length, stop-loss distance, profit target, and trailing stop distance.
- Fixed rules: market selection, entry direction, signal definition, order type, and the core exit logic.
- Optimized parameters: indicator lookbacks, threshold values, stop-loss percentages, profit targets, and position-sizing limits.
Keep the parameter set deliberately small. Testing five values for each of six independent inputs creates 15,625 combinations, many of which may appear attractive solely by chance. Every parameter should have a trading rationale. A 10- to 30-bar breakout range may be defensible because it represents different holding horizons. Testing arbitrary values solely because they improve a backtest is not.
Select practical in-sample and out-of-sample windows
Choose window lengths based on the strategy timeframe, expected trade frequency, and how quickly the relevant market behavior changes. An in-sample period must contain enough trades to estimate performance with some confidence, while the out-of-sample period must be long enough to expose the selected settings to conditions not used during optimization.
For a daily strategy, a practical schedule could be:
- Optimize parameters using the prior three years of daily data.
- Apply the selected parameter set to the next six months without further adjustment.
- Roll the test forward by six months, re-optimize on the most recent three years, and repeat.
For a faster intraday strategy, the same calendar lengths may be inappropriate. Use windows that generate a meaningful number of completed trades, but avoid an in-sample period so long that it includes obsolete volatility, liquidity, or market-structure conditions. A strategy trading several times per day may support shorter rolling windows than one producing only a few trades each month.
The central trade-off is unavoidable: longer windows provide more observations and usually more stable estimates, while shorter windows adapt more quickly but increase the risk that the chosen parameters reflect temporary noise. Review results across multiple rolling segments rather than relying on one favorable validation period.
Build realistic testing assumptions
Walk-forward results are only useful if the execution model resembles the conditions the automated strategy would face. Include commissions, estimated slippage, bid-ask spreads where applicable, and realistic position sizing. If the intended deployment uses a fixed allocation, Percent of equity, or Risk percent approach, model that same approach consistently throughout the test.3
Do not assume every historical signal receives a perfect fill at the signal price. This is especially important for breakouts, market-open signals, fast-moving instruments, and low-liquidity periods, where Stop Market orders and other marketable orders can fill materially away from the trigger level.4 Apply a conservative slippage estimate to both entries and exits when appropriate.
Use identical execution assumptions in every in-sample and out-of-sample segment. Otherwise, the stitched out-of-sample equity curve mixes incompatible results and cannot be interpreted reliably.
- Test universe: symbols, asset classes, and liquidity filters.
- Data specification: timeframe, session coverage, and sample dates.
- Execution assumptions: commissions, spreads, slippage, order handling, and position sizing.
- Optimization design: tested parameter ranges, increment sizes, selection criteria, and rolling schedule.
Record these details for every run. A walk-forward test should be reproducible, reviewable, and comparable when strategy rules or market conditions change.
A Practical Walk-Forward Optimization Example
Example: Optimizing a Trend-Following Strategy
Consider a daily trend-following strategy on a liquid index ETF. The strategy enters long when a faster moving average crosses above a slower moving average and exits when the fast average crosses back below the slow average. This is deliberately simple: the purpose is to evaluate the walk-forward process, not to imply that a moving-average crossover is sufficient for every market or trading objective.
Define a constrained parameter grid before testing. For example:
- Fast moving average: 10, 15, 20, 25, and 30 periods
- Slow moving average: 50, 60, 70, 80, 90, and 100 periods
- Rule constraint: the fast average must remain shorter than the slow average
Do not rank combinations on net profit alone. A 10/50 combination may produce the highest in-sample return while carrying a drawdown that is unacceptable for the account size or risk limits. Review maximum drawdown, profit factor, trade count, average trade value, and the consistency of results among nearby parameter combinations. A parameter region where 15/60, 20/60, and 20/70 all perform reasonably is generally more credible than a single isolated result such as 10/50 that substantially outperforms every neighboring setting.
Select a parameter set using predefined criteria, such as acceptable drawdown, sufficient trade count, and a profit factor above a chosen threshold. The selected combination is only the best candidate for that specific historical optimization window, not a universally best setting.
Walk Forward Through Sequential Windows
Use sequential optimization and validation windows that preserve the order in which information became available. For example, optimize the strategy from January 2018 through December 2020. Select parameters using only that data, then validate those fixed parameters from January through June 2021.
Next, roll the windows forward: optimize from July 2018 through June 2021, then validate from July through December 2021. Continue this sequence through the most recent completed historical period. Each validation segment must use only the parameter selection from the immediately preceding optimization window.
- Optimization window: January 2018 to December 2020
- Out-of-sample validation: January 2021 to June 2021
- Optimization window: July 2018 to June 2021
- Out-of-sample validation: July 2021 to December 2021
Do not alter entry logic, exit logic, parameter ranges, or selection criteria after reviewing an out-of-sample result. Changing rules after seeing validation performance imports future knowledge into the research process and compromises the integrity of the test.
Stitch the Out-of-Sample Results Into One Equity Curve
Combine only the trades from each out-of-sample validation segment, in chronological order, into one continuous equity curve. Exclude optimization-period trades from this curve. The stitched result is the primary record of how the process performed when parameters were selected without access to the subsequent validation period.
Review the curve for persistent losses, abrupt failures during particular market regimes, drawdown severity, and whether returns are reasonably distributed across validation windows. Compare the stitched out-of-sample performance with the in-sample results. A large decline in profit factor, a materially deeper drawdown, or a sharp reduction in trade quality may indicate overfitting.
For a visual walkthrough of this workflow, see AlgoTrading101's walk-forward optimization guide.
How to Evaluate Walk-Forward Results
Focus on Robust Metrics, Not the Highest Return
Evaluate each walk-forward validation window using a group of metrics, not net return alone. A strong result should show an acceptable combination of net return, maximum drawdown, profit factor, win rate, average trade, trade count, and consistency across validation windows.
- Maximum drawdown measures whether the return was achieved with tolerable equity risk.
- Profit factor shows whether gross profits meaningfully exceed gross losses.
- Average trade should remain large enough to survive commissions, spreads, and slippage.
- Trade count indicates how much evidence supports the result.
For example, a validation period showing a 35% return from four trades is generally less persuasive than a 14% return from 85 trades with a similar profit factor and lower drawdown. Four trades can be dominated by one unusually favorable move. Eighty-five trades provide a broader sample of the strategy's behavior.
Define an acceptable return-to-drawdown relationship before selecting settings. A trader willing to tolerate a 12% drawdown may reject a configuration that produces a 20% return with a 28% drawdown, even if it is the highest-returning candidate. Recalculate results using conservative assumptions for commissions, bid-ask spread, and slippage. If profitability disappears under realistic execution costs, the walk-forward result is not operationally robust.
Look for Parameter Stability
Robust strategies usually perform reasonably well across a neighborhood of similar parameter values. Do not automatically select the single highest in-sample setting if nearby settings deteriorate sharply.
Suppose a trend strategy produces its best result with a 17-period lookback. If 16 and 18 periods both fail dramatically, the 17-period result may be an isolated fit to historical noise. In contrast, if settings from 15 through 20 periods all remain profitable with comparable drawdowns, that range provides stronger evidence that the parameter reflects a persistent market relationship.
- Compare the selected setting with adjacent values in every optimization window.
- Favor stable parameter regions over the highest individual in-sample return.
- Review whether the selected values shift materially from one walk-forward window to the next.
Recurring, large parameter changes can indicate that the optimization process is adapting to random variation rather than identifying durable behavior. A strategy that alternates between very short and very long lookbacks without a clear market explanation deserves additional skepticism.
Identify Regime-Specific Weaknesses
Break the stitched out-of-sample equity curve into identifiable market regimes: sustained trends, sideways ranges, high-volatility periods, and trend reversals. Determine whether losses cluster in a specific environment or appear randomly across all conditions.
A breakout strategy that performs well during persistent directional moves but loses during narrow ranges has an understandable weakness consistent with its hypothesis. A strategy that alternates unpredictably between gains and losses in every regime has less explanatory support, even if its aggregate walk-forward return is positive.
Use this analysis to decide whether the strategy should be traded only when conditions objectively match its premise. Any regime definition must be measurable and testable, such as volatility relative to a predefined historical threshold or price relative to a specified trend measure. Avoid repeatedly adding filters after reviewing the outcome. Each new filter creates another optimization decision and another opportunity to curve fit the historical sample.
Common Walk-Forward Optimization Mistakes
Optimizing Too Many Inputs
Walk-forward optimization becomes unreliable when the search includes every available indicator, threshold, exit rule, and market filter. A strategy with 10 inputs, each tested at 10 values, creates 10 billion possible combinations. Even if the optimizer evaluates only a smaller subset, extensive searching increases the probability of finding a parameter set that performed well by chance rather than because it reflects a genuine market relationship.
Limit optimization to the variables most directly tied to the strategy hypothesis. For example, if the premise is that a moving-average pullback performs best when momentum remains positive, optimize the moving-average length and momentum threshold. Do not simultaneously optimize unrelated variables such as day-of-week filters, multiple volume filters, five different stop types, and several profit targets unless each has a clear reason to exist.
- Use broad, practical ranges, such as a 10 to 50 bar moving average in 5-bar steps.
- Avoid meaningless precision, such as testing RSI thresholds of 54.1, 54.2, and 54.3.
- Prefer parameter regions that remain effective across nearby values, not one isolated “best” setting.
Using Too Little Data or Too Few Trades
A short historical sample can reflect one unusual environment, such as a persistent bull trend, a volatility shock, or abnormal liquidity conditions. A parameter set that appears robust in that sample may fail when market behavior changes. Walk-forward analysis needs enough data to include multiple regimes and enough trades to make each in-sample and out-of-sample result meaningful.
This is especially important for low-frequency strategies. A swing strategy that produces two trades per month may need several years of history before each out-of-sample segment contains enough activity to evaluate. Ten profitable trades in one segment do not establish a durable edge, particularly if one large winner accounts for most of the return.
- Review trade count, win/loss distribution, drawdown, and average trade, not just net profit.
- Check every out-of-sample segment separately for sufficient signal activity.
- Extend the historical window when a segment contains too few trades to support a conclusion.
Treating Out-of-Sample Results as a Guarantee
A strong walk-forward result is evidence of historical robustness, not a prediction of future returns and not protection against losses. Markets can change after testing. Liquidity may decline, volatility may expand, spreads may widen, and execution conditions may differ from the assumptions embedded in historical data.
Use walk-forward expectations as a benchmark for ongoing monitoring. Compare live or Paper trading performance with validated expectations for trade frequency, drawdown, average trade, and losing streaks. A material deviation does not automatically invalidate the strategy, but it should trigger a review of market conditions, execution assumptions, and whether the strategy is operating within its intended conditions.
Skipping Paper Trading Before Automation
Historical validation and Paper trading answer different questions. Walk-forward testing evaluates whether the strategy’s rules behaved consistently across historical periods. Paper trading verifies the practical signal-to-order workflow: whether alerts arrive as expected, entries are submitted in the intended direction, exits are applied correctly, and position sizing matches the plan.
Run the validated strategy in Paper trading long enough to observe signals during normal and volatile sessions. Confirm that long and short actions behave as intended, that stop-loss and take-profit instructions match the strategy design, and that alert frequency is consistent with the expected trade rate. Before using real money, verify position size, entry direction, exits, and any Trading Windows or Entry Lock settings that govern when new positions may be opened.5
Move a Validated Strategy Toward Automated Execution
Turn Objective Strategy Signals Into Alerts
Automation is most reliable when every trade decision is defined before the alert is sent. A validated strategy should specify the exact entry condition, exit condition, direction, and position-sizing method without requiring discretionary interpretation. For example, “enter long when the 20-period moving average crosses above the 50-period moving average at bar close, allocate 2% of equity” is objective. “Enter when momentum looks strong” is not.
Use TradingView or TrendSpider alerts only after the underlying rules have completed walk-forward testing. The alert logic should match the tested logic, including indicator settings, timeframe, signal confirmation timing, and sizing assumptions. If the walk-forward test entered only after a bar closed, the live alert should not trigger intrabar. If the test used a fixed quantity or a defined Percent of equity approach, do not substitute a different sizing rule during deployment.
Keeping live alerts aligned with the validated strategy prevents execution drift, where a strategy that passed testing becomes a materially different strategy in automation.
Use Clear Alert Details for Each Trade Instruction
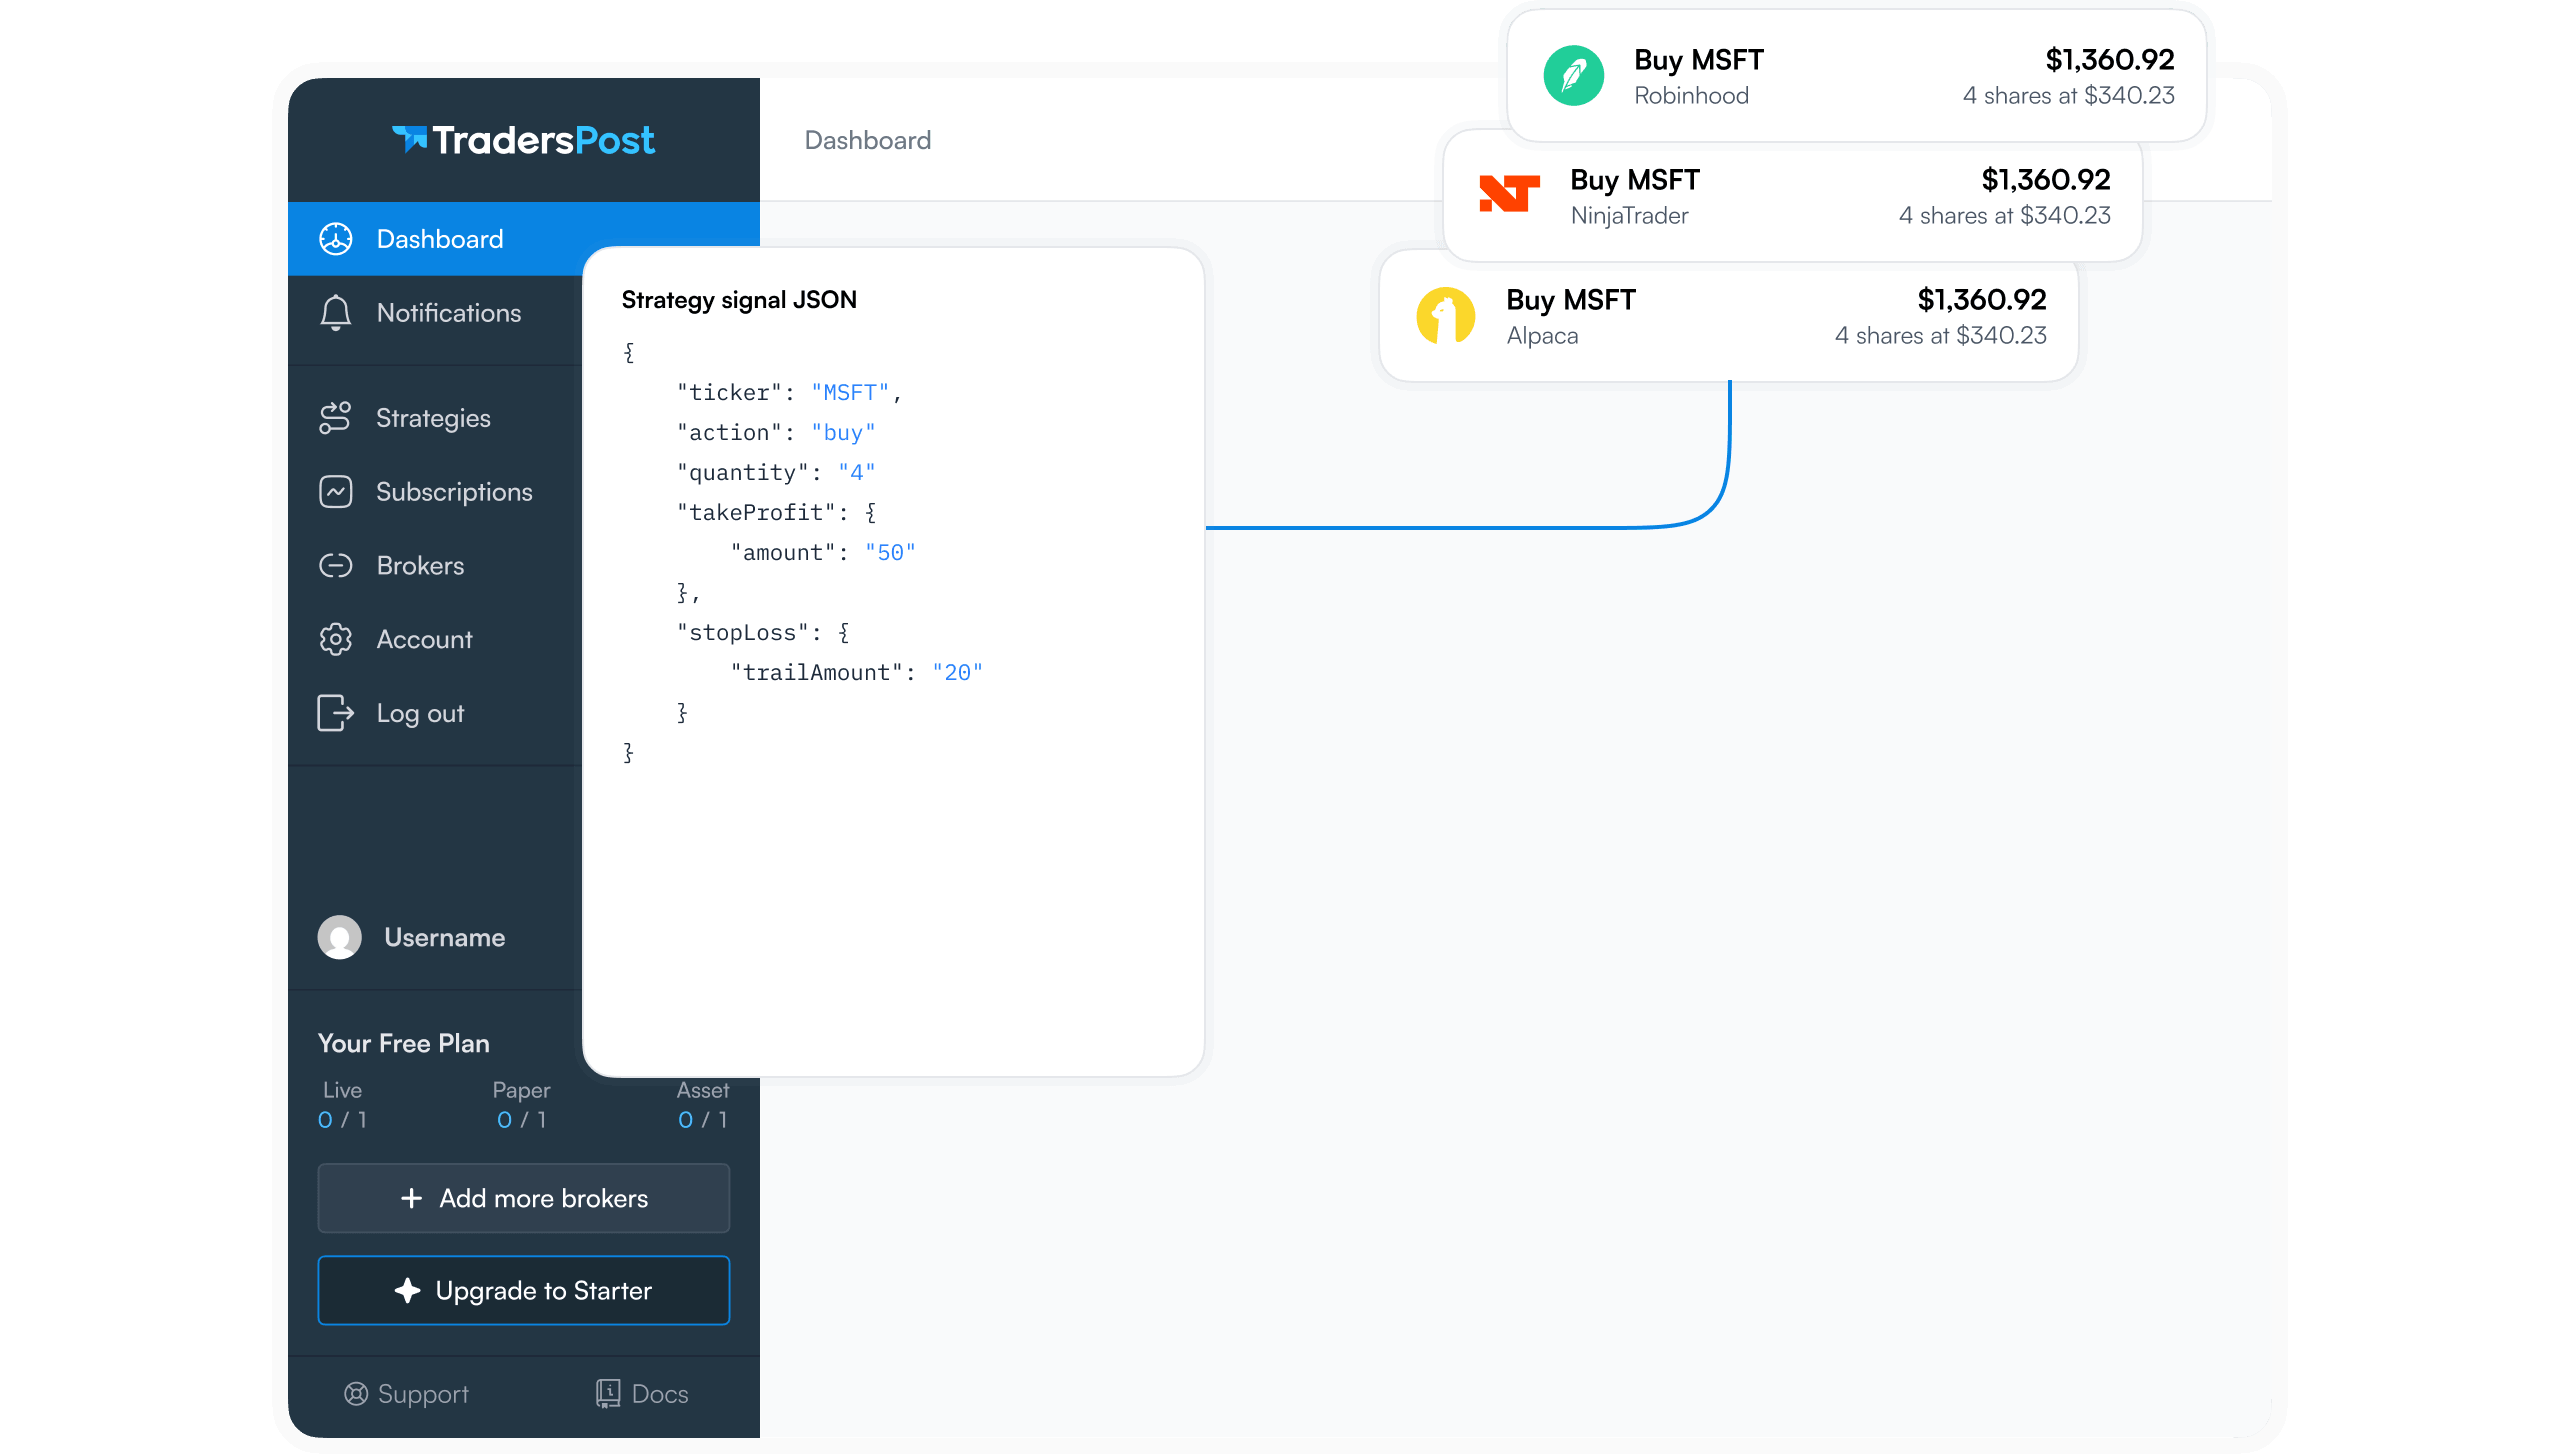
Each alert should communicate a complete, unambiguous instruction. At a minimum, provide the intended ticker, action, and quantity. For example, an alert may instruct an automated workflow to buy 100 shares of a specified ticker, or to close an existing position using the appropriate action defined by the execution plan.
- ticker: The exact instrument symbol intended for the trade.
- action: The intended instruction, such as entering, closing, buying, or selling according to the strategy’s established trade logic.
- quantity: The tested position size, expressed consistently with the strategy’s sizing methodology.
- takeProfit and stopLoss: Include these only when they reflect the exit methodology used in walk-forward testing.
- expiration: Include this only when the order timing requires it, and use a value consistent with the execution plan.
Do not add untested order behavior after the walk-forward process is complete. For instance, if the tested strategy exited on a moving-average reversal, adding a new fixed takeProfit or stopLoss changes the strategy’s payoff distribution and invalidates the relevance of the prior test.
Paper Trade, Review, Then Consider Live Deployment
Use a staged rollout:
- Complete walk-forward testing across relevant market regimes.
- Configure TradingView or TrendSpider alerts to reproduce the tested rules.
- Run the strategy through Paper trading.
- Compare paper-trading results with the tested assumptions and expected trade behavior.
- Only then consider a small live allocation.
Review every paper trade. Confirm that the selected symbol was correct, the direction matched the signal, the quantity followed the tested sizing rule, and the intended exit behavior was present. Investigate discrepancies immediately, especially those caused by alert timing, symbol formatting, or changes to alert conditions.
Automation does not remove the trader’s responsibility to monitor the strategy. Reassess performance when volatility, liquidity, trend persistence, or market structure changes materially. Trading involves risk, and prior simulated or historical performance does not guarantee future results.
Frequently Asked Questions
What is walk-forward optimization in trading?
Walk-forward optimization is a strategy-testing method that repeatedly optimizes a trading system using an in-sample historical data window, then tests those selected parameters on the next out-of-sample window. The process is repeated across multiple periods. Each out-of-sample result is then stitched together to show how the strategy may have performed on data that was not used to choose its settings. This helps create a more realistic view of historical strategy performance.
What is the difference between backtesting and walk-forward optimization?
A standard backtest may evaluate a strategy over one historical period using settings that were influenced by the same data being tested. That can make results look stronger than they would be in live markets. Walk-forward optimization repeatedly separates optimization data from validation data. By testing each parameter set on unseen out-of-sample data, it is more useful for identifying potential curve fitting and evaluating whether a strategy is more robust.
How long should in-sample and out-of-sample windows be?
There is no universal window length for walk-forward optimization. Choose in-sample and out-of-sample periods based on your trading timeframe, trade frequency, available historical data, and how quickly market behavior changes for the strategy. Each window should include enough trades and market data to produce meaningful results. At the same time, the full test should include multiple validation periods across different market regimes, such as trending, volatile, and range-bound conditions.
Does walk-forward optimization guarantee a profitable strategy?
No. Walk-forward optimization can improve the quality of strategy evaluation, but it cannot guarantee future profits or prevent trading losses. Markets change, execution conditions vary, and live results may differ from historical testing. Use walk-forward testing alongside realistic assumptions for commissions, slippage, and fills. You should also have clear risk-management rules, monitor performance over time, and paper trade before committing real capital to an automated strategy.
Can I automate a walk-forward tested strategy with TradersPost?
Yes. After validating your strategy, you can use TradingView or TrendSpider webhook alerts with TradersPost to automate order execution through a connected broker.6 Before trading live, paper trade the complete workflow, including alerts, webhook delivery, position sizing, and broker execution. Keep your live alert instructions consistent with the strategy you tested, since changing entry rules, exits, symbols, or sizing can materially change results. Continue monitoring the strategy after deployment.
Conclusion
Walk-forward optimization turns strategy development into a more realistic test of whether an edge can survive changing market conditions. Rather than selecting parameters solely because they performed well in one historical period, it repeatedly optimizes on past data and validates on unseen data. The most credible results show reasonable performance across multiple windows, acceptable drawdowns, stable trade behavior, and parameter ranges that remain effective without excessive tuning.
Before risking capital, confirm that your process includes realistic costs, slippage assumptions, position sizing rules, and a paper-trading rollout checklist. Then use TradersPost to paper trade your walk-forward validated TradingView or TrendSpider alert strategy before considering live automation. Monitor actual alert execution, fills, and risk controls against your test assumptions, refine only when evidence supports a change, and move forward with confidence and discipline.
References
1 QuantInsti, Walk-Forward Optimization
2 TradersPost Docs, Paper Trading
3 TradersPost Docs, Position Sizing
4 TradersPost Docs, Order Behavior
5 TradersPost Docs, Webhooks
6 TradersPost Docs, TradingView Signal Source