Backtesting Market Regimes for 2026 Strategies
Learn backtesting market regimes for 2026, then forward-test AI, crypto, and meme-stock strategies with paper trading and automated execution rules safely.

Marketing

Bottom Line
- During the AI-led trend window from January 2 to May 29, 2026, trend-following and breakout systems are expected to outperform, while short-premium systems need gap-risk controls due to persistent upward trends and moderate-to-high volatility.
- The early-June crypto correction, from June 1 to June 14, 2026, features sharp corrections with elevated 20-day ATR percentiles, where breakout shorts and volatility-responsive sizing should be tested as long mean-reversion entries may fail.
- Meme-stock episodes in 2026 are characterized by explosive volume and extreme volatility, requiring stop-loss assumptions and fill models to account for gap-through risk and widened spreads.
- For a bullish trend filter, require price above a rising 50-day moving average and ADX above 25, while high volatility requires the 20-day ATR percentile to exceed 70 relative to the prior 252 sessions.
- A trend-following breakout model during the AI rally may produce 0.42R expectancy and a 1.85 profit factor, but lose 0.18R per trade with six-trade loss streaks in low-ADX control periods.
A strategy that thrives in an AI-led momentum surge can fail quickly when volatility spikes, liquidity thins, or speculative capital rotates into crypto and meme stocks. That is why backtesting market regimes matters more than testing a single equity curve across a broad historical period. For 2026, the relevant question is not whether a setup produced attractive average returns, but how it performed during risk-on rallies, inflation shocks, rate repricing, volatility expansions, and abrupt correlation breakdowns.
This guide shows you how to define useful market regimes, segment historical data, and measure whether entries, exits, position sizing, and options hedges held up in conditions resembling today’s AI, crypto, and retail-driven trading cycles. You will learn how to separate genuine regime-dependent edge from overfit results, then move the strongest ideas into forward testing with paper trading.1 Finally, you will see how to build automated execution rules with clear risk limits, so a promising backtest becomes a controlled, observable 2026 strategy rather than an expensive live-market experiment.
What Backtesting Market Regimes Means in 2026
Why a Strategy Can Pass a Backtest and Fail in a New Regime
An aggregate backtest can report an attractive Sharpe ratio, low drawdown, and positive expectancy while concealing a critical dependency: most profits may have been earned during one narrow environment. A long-only pullback system, for example, may generate nearly all of its returns during a sustained AI-led equity advance, then lose repeatedly when leadership rotates, correlations rise, and overnight gaps become more frequent.
For automated trading, a market regime is a measurable combination of trend direction, volatility level, cross-asset correlation, liquidity, market breadth, and mean-reversion behavior. A regime is not merely “bullish” or “bearish.” It describes the conditions under which order flow and price behavior change enough to alter a strategy’s expectancy.
The objective is not to predict the next regime perfectly. It is to establish where a strategy historically performs, underperforms, or should be disabled. Report performance separately by regime: net return, trade count, win rate, average win/loss, maximum drawdown, turnover, slippage, and exposure-adjusted return. A strategy with positive aggregate results but a deeply negative regime bucket is not robust unless its deployment logic can reliably avoid that bucket.
The 2026 Regimes to Isolate in Your Tests
Treat prominent 2026 market episodes as separate test windows, not as one continuous sample. The labels below are hypotheses, not conclusions. Confirm each window using realized volatility, trend persistence, drawdown, volume, gap frequency, and intraday range before attributing performance to a regime.
| Date range | Affected symbols or sectors | Trend/volatility classification | Relevant strategy expectations |
|---|---|---|---|
| January 2 to May 29, 2026 | AI infrastructure, semiconductors, mega-cap technology, related ETFs | Persistent upward trend, elevated dispersion, moderate-to-high realized volatility | Trend-following and breakout systems should outperform; short-premium systems require gap-risk controls. |
| June 1 to June 14, 2026 | BTC, ETH, crypto-linked equities, miners, high-beta tokens | Sharp correction, elevated 20-day ATR percentile, larger continuous-session moves | Long mean-reversion entries may fail early; breakout shorts and volatility-responsive sizing should be tested. |
| 2026 meme-stock episode windows | High-short-interest equities, retail-flow names, selected small caps | Explosive volume, discontinuous gaps, unstable liquidity, extreme idiosyncratic volatility | Stop-loss assumptions and fill models must include gap-through risk, halts, and widened spreads. |
Use Objective Definitions Instead of Narrative Labels
Define regimes before evaluating strategy results. For a bullish trend filter, require price above a rising 50-day moving average and ADX above 25. For high volatility, require the 20-day ATR percentile to exceed 70 relative to the prior 252 sessions. For choppy conditions, use ADX below 20 plus frequent moving-average crosses, such as at least four 10-day/30-day crossovers during the prior 60 sessions.
- Stocks: measure overnight gap frequency, opening-range volatility, relative volume, bid-ask spread, and session-based realized volatility.
- Crypto: use rolling 24-hour returns, continuous realized volatility, weekend liquidity, perpetual-futures funding, and liquidation-driven volume.
- Validation: freeze regime rules, then test them on out-of-sample periods. Do not redefine a “trend regime” after discovering which threshold produced the best historical equity curve.
Build a 2026 Regime Test Dataset Before Changing Parameters
Segment Data Into Comparable Test Windows
Do not optimize against a single January-to-date equity curve. Partition the 2026 sample into economically distinct windows, then run the identical strategy configuration through each one. At minimum, create four labeled datasets: the AI-led trend window, the early-June crypto correction window, meme-stock event windows, and neutral or choppy control periods.
- AI-led trend window: Include sustained directional advances in AI-linked equities, semiconductors, infrastructure names, and correlated index products. This tests whether trend entries, breakout filters, and trailing exits capture persistent momentum.
- Early-June crypto correction: Isolate the decline and subsequent rebound separately if market structure changed materially. This tests downside execution, stop behavior, and whether long-only logic improperly assumes continuous risk-on conditions.
- Meme-stock event windows: Use event dates plus defined pre-event and post-event sessions. Include names only if they were in the tradable universe before the event, avoiding survivorship bias.
- Neutral control periods: Select low-ADX, overlapping-range periods with no major event catalyst. These are essential for measuring churn and false-signal frequency.
Keep the symbol universe, market-session rules, commission model, signal timeframe, and position-sizing baseline constant across every window. A 15-minute equity breakout system should not use regular-hours-only data during choppy controls and extended-hours data during meme-stock events unless extended-hours trading is a documented production rule. Require sufficient observations, preferably dozens of completed trades per regime and enough bars to cover multiple volatility cycles. A result driven by three exceptional gap moves is not evidence of a robust parameter.
Track the Metrics That Reveal Regime Dependence
Calculate a separate scorecard for each regime rather than relying on aggregate net profit. Record net profit, profit factor, expectancy per trade, maximum drawdown, win rate, average win, average loss, trade count, and percentage of time in market. Normalize dollar results by fixed risk per trade or account equity so that a high-volatility window does not appear superior merely because it generated larger nominal moves.
Add diagnostics that identify why performance changes:
- Expectancy and fill quality on gap days versus non-gap days.
- Performance when ATR is above the symbol's rolling 75th percentile.
- Consecutive-loss streaks, especially during low-ADX or mean-reverting periods.
- Entry-to-maximum-adverse-excursion and entry-to-maximum-favorable-excursion distributions.
Example scorecard: A trend-following breakout model may produce 0.42R expectancy and a 1.85 profit factor during the AI rally, but lose 0.18R per trade with six-trade loss streaks in low-ADX control periods. The correct conclusion is not automatically to tighten the stop. First determine whether an ADX, relative-volume, or opening-range filter removes low-quality conditions without materially degrading trend-window participation.
Model Realistic Execution Constraints
Backtests for automated strategies must simulate the path from signal generation to executable order. Apply commissions, bid-ask spreads, directional slippage, and partial-fill logic where order size is meaningful relative to displayed liquidity. For stocks, model wider spreads and unstable fills near the open. A breakout signal triggered by a 9:30 bar should not assume a fill at that bar's closing price if the alert reaches the broker after the candle closes.
For crypto, preserve 24/7 timestamps, exchange-specific maker and taker fees, funding where applicable, and liquidity differences by venue and trading hour. Apply larger adverse slippage during rapid corrections, particularly for stop-market exits. If a strategy depends on intrabar stop execution, use lower-timeframe or tick-level data where available. Bar-close fills can materially overstate performance when volatility expands between the alert, order submission, and actual fill.2
Match Strategy Logic to Trending and Choppy Conditions
Trend-Following Rules for the AI Rally Environment
A trend-following backtest should separate entry quality from exit quality. For an AI-linked equity basket, test a baseline rule that buys a close above the prior 20-day high only when price is above a rising 50-day moving average and the 14-day ADX is above 25. Define “rising” mechanically, for example, the current 50-day average must exceed its value five sessions earlier. This prevents the system from treating every short-term range break as a durable trend.
Do not assume that a breakout close is the best entry. Run the same signal with alternative execution logic:
- Enter at the next session’s open after the 20-day breakout.
- Place a limit entry on a retracement to the 10-day or 20-day EMA, valid for three trading sessions.
- Require a pullback that holds above the 50-day moving average before entering.
Evaluate exits independently across persistent trend samples. Compare a 3 ATR trailing stop, a close below the 20-day EMA, a 10-day time stop, and partial profit-taking such as selling one-half at 2R while trailing the remainder. Report average trade return, median return, maximum adverse excursion, trend-capture percentage, and the fraction of gains generated by a small number of extended winners.
Defensive Rules for the Early-June Crypto Correction
During a broad crypto drawdown, long-only logic needs an explicit defensive state rather than relying on ordinary stop-loss behavior. Backtest whether the system performs better when it cuts position size by 50%, pauses new long entries, tightens portfolio exposure limits, or requires higher-timeframe confirmation. A practical filter is to permit daily long signals only when the asset is above its 200-day moving average and the total crypto market index is above its 50-day moving average.
For systems permitted to short, compare distinct hypotheses rather than treating bearish direction as sufficient:
- Short continuation after a close below a 20-day low.
- Short failed bounces that reverse below a declining 20-day EMA.
- Trade mean reversion after unusually large one-day declines, with tightly defined profit targets and short holding periods.
Use volatility-adjusted risk. A fixed 3% stop may be routine noise when daily realized volatility is elevated. Test initial stops such as 2 to 3 ATR, then reduce position size so each position still risks a fixed portfolio amount, for example 25 to 50 basis points of equity.
Event-Driven Controls for Meme-Stock Episodes
Meme-stock episodes can produce genuine breakouts, but also abrupt reversals, trading halts, wide spreads, partial fills, and overnight gaps that invalidate ordinary assumptions about stop execution. Model entries using conservative execution assumptions, including spread costs, slippage proportional to volatility, and next-bar execution rather than fills at the signal close.
Apply testable liquidity and concentration controls:
- Require at least $20 million in 20-day average daily dollar volume.
- Reject entries when the quoted spread exceeds 1% of price.
- Block new positions after an opening gap larger than 15%, unless the strategy is specifically designed for gap events.
- Cap simultaneous event-driven positions, such as three names or 10% of portfolio gross exposure.
Prioritize hard risk limits over historical optimization. A backtest dominated by a few extraordinary event-day gains is fragile. Test daily loss limits, symbol-level exposure caps, halt-aware order handling, and gap stress scenarios before accepting any apparent edge.
Run Regime-by-Regime Backtests Without Overfitting
Use a Baseline Before Creating Regime Variants
Begin with one stable, fully specified strategy before introducing separate trend, range, high-volatility, or low-volatility configurations. Record every executable rule: entry trigger, exit logic, bar timeframe, eligible symbols, trading session, stop placement, profit-taking rule, position-sizing formula, maximum concurrent positions, and treatment of gaps and unfilled orders. For automated execution, the backtest specification should match the production rule set closely enough that another developer could reproduce it without interpretation.
Run this baseline unchanged across each predefined 2026 evaluation window, such as January-February, March-April, and May-June, as well as across the full available 2026 sample. Measure net return, maximum drawdown, profit factor, trade count, average trade expectancy, turnover, and exposure-adjusted returns. A strategy that is merely acceptable across multiple conditions is usually a better foundation than one that excels in a single trend period and fails during consolidation.
- Do not change entries, stops, and sizing simultaneously. If a trend variant improves results, isolate whether the improvement came from the regime filter, a wider ATR stop, or reduced risk per trade.
- Version every test. Store the code commit, data version, parameter file, execution assumptions, and regime labels used for each run.
- Use regime variants only after baseline weaknesses are identified. For example, add an ADX filter only if trade-level data shows that low-directional-strength periods produce repeated false breakouts.
Optimize a Small Number of Meaningful Parameters
Restrict optimization to parameters with a direct economic or market-structure rationale. For a breakout system, reasonable candidates include breakout lookback, ADX threshold, moving-average length, ATR stop multiple, and maximum risk per trade. Test narrow ranges rather than sweeping hundreds of combinations. A 15-to-25-bar breakout lookback in one-bar increments is defensible if the strategy is designed to capture multi-week directional moves. Testing 2 through 200 bars without a prior hypothesis is usually parameter mining.
Evaluate parameter stability rather than selecting the highest single backtest result. Seek a plateau, where several adjacent settings produce comparable returns and drawdowns. For example, if 18-, 20-, and 22-bar breakouts generate similar expectancy and acceptable drawdowns during 2026 trend windows, select the simpler 20-bar value. Do not select a 19-bar setting solely because it produced the highest net profit if neighboring values deteriorate materially. That isolated peak is more likely to reflect sample-specific noise than a durable market effect.
- Require a minimum trade count before comparing settings, especially for higher-timeframe systems.
- Include commissions, spread, slippage, partial fills, and realistic stop execution assumptions.
- Prefer parameters that remain viable across symbols and regime windows, not just one instrument or one month.
Reserve Out-of-Sample Periods for Validation
Separate development data from validation data before optimization begins. For example, develop parameters using historical data through 2025 plus an initial 2026 window, then evaluate the final configuration on a later 2026 window that was not inspected during tuning. The out-of-sample period must remain untouched: no threshold adjustments, stop changes, or selective removal of losing trades after its results are known.
Where sufficient history exists, use walk-forward analysis.3 Optimize on a rolling window, such as the prior 24 months, deploy the selected parameters on the next one or two months, then advance the window and repeat. Aggregate the unseen test segments to estimate how the automated strategy would have behaved under repeated re-calibration.
Reject configurations that work only during one named event window, only on one symbol, or only after extensive tuning. A regime-aware strategy should demonstrate a repeatable relationship between its filter and subsequent trade quality, not a retrospective fit to a single 2026 market episode.
Forward-Test the Best Rules on a Paper Account
Know the Difference Between Backtesting and Forward Testing
Backtesting asks whether a fully specified regime-based rule set would have performed on historical data. Forward testing asks whether that same rule set can operate correctly on new, unseen market data without discretionary changes after each trade, loss, or market move.
For example, a backtest may show that a short premium strategy performs well only when implied volatility rank exceeds 45, the 20-day realized volatility slope is positive, and the S&P 500 remains above its 200-day moving average. During the paper test, those thresholds must remain fixed. The objective is not to improve the strategy in real time. It is to determine whether the historical edge survives current conditions, real-time signal generation, and execution mechanics.
Set the validation period by expected signal frequency, not by a calendar date alone. A weekly options strategy may require at least 30 to 50 valid signals, while an intraday futures system may generate that sample within several weeks. The sample should also include more than one market condition, such as a persistent trend, a range-bound period, and a volatility expansion or contraction. For a detailed framework covering sample design, walk-forward periods, and statistical evaluation, refer to the existing forward-testing article rather than treating this paper phase as a general strategy explainer.
Create a Paper-Trading Checklist for Every Alert
Each automated alert should be treated as an operational audit event. A strategy can have valid historical logic and still fail because the live alert, broker routing, position sizing, or exit management differs from the tested implementation.
- Confirm that the alert fired at the intended timestamp and reference price.
- Verify the correct symbol, expiration, strike selection logic, direction, and order quantity were transmitted.
- Compare the expected backtest entry with the actual paper fill, including bid-ask spread and any delay between signal creation and order acceptance.
- Confirm that stop-loss, profit target, trailing stop, and time-based exit instructions behaved as specified.
- Log rejected orders, duplicate alerts, partial paper fills, stale quotes, and missed signals.
- Record the active market regime at entry and exit so that performance can be evaluated by regime rather than only at portfolio level.
Also assess conditions that historical bars can hide. A five-minute backtest may assume a fill at the closing price, while a real-time alert arrives during a widening spread, a session transition, or a rapid reversal through the stop level. If an options spread historically earned $0.20 per contract but typical real-time spread cost and adverse fill risk are $0.12, the live implementation may not retain a sufficient edge.
Freeze the Rules During the Validation Sample
Do not alter indicator lengths, stop distances, profit targets, position size, or regime thresholds after a small cluster of losses. Changing a volatility threshold from 45 to 55 after three losing trades converts the forward test into an optimization exercise and invalidates the sample.
Separate operational corrections from strategy changes. Correcting a malformed webhook field, mapping the wrong option symbol, or changing a market order to a limit order because the original order type was not transmitted correctly is an operational fix. Changing the entry condition, exit rule, or regime classifier is a strategy modification and requires a new validation sample.
Define pass/fail criteria before the first paper trade. Typical criteria include a maximum paper drawdown, minimum trade count, alert-to-order accuracy rate, acceptable average slippage, maximum rejected-order rate, and minimum performance by regime. For example, require 40 completed signals, at least 99% correct alert transmission, average entry slippage below 10% of expected trade credit, and no regime-specific drawdown beyond the pre-defined risk limit. If the strategy fails, diagnose the cause without rewriting the rules mid-sample.
Automate Regime-Aware Execution With TradersPost
Turn Regime Filters Into TradingView or TrendSpider Alerts
Translate the exact regime logic used in the backtest into alert conditions, rather than treating regime identification as a discretionary pre-trade judgment. An alert should fire only when all required conditions are true: the strategy entry setup is present, the market regime filter is valid, the symbol passes eligibility rules, and the proposed trade meets its risk constraints.
- Entry condition: A 20-day high breakout with volume greater than 1.5 times its 20-day average.
- Regime filter: Enable the breakout only when daily ADX(14) is above 25, indicating sufficient trend strength.
- Symbol eligibility: Trade only symbols above $10, with average daily dollar volume above $20 million, and an available options or equity route supported by the broker.
- Risk condition: Reject the alert if the stop distance requires a position larger than the configured maximum size or if the daily loss limit has been reached.
For a mean-reversion system, invert the logic where appropriate. For example, disable long dip-buying entries when the 14-day ATR is above the 80th percentile of its trailing 252-day distribution. That rule prevents a backtested low-volatility reversion model from continuing to buy during volatility expansion.
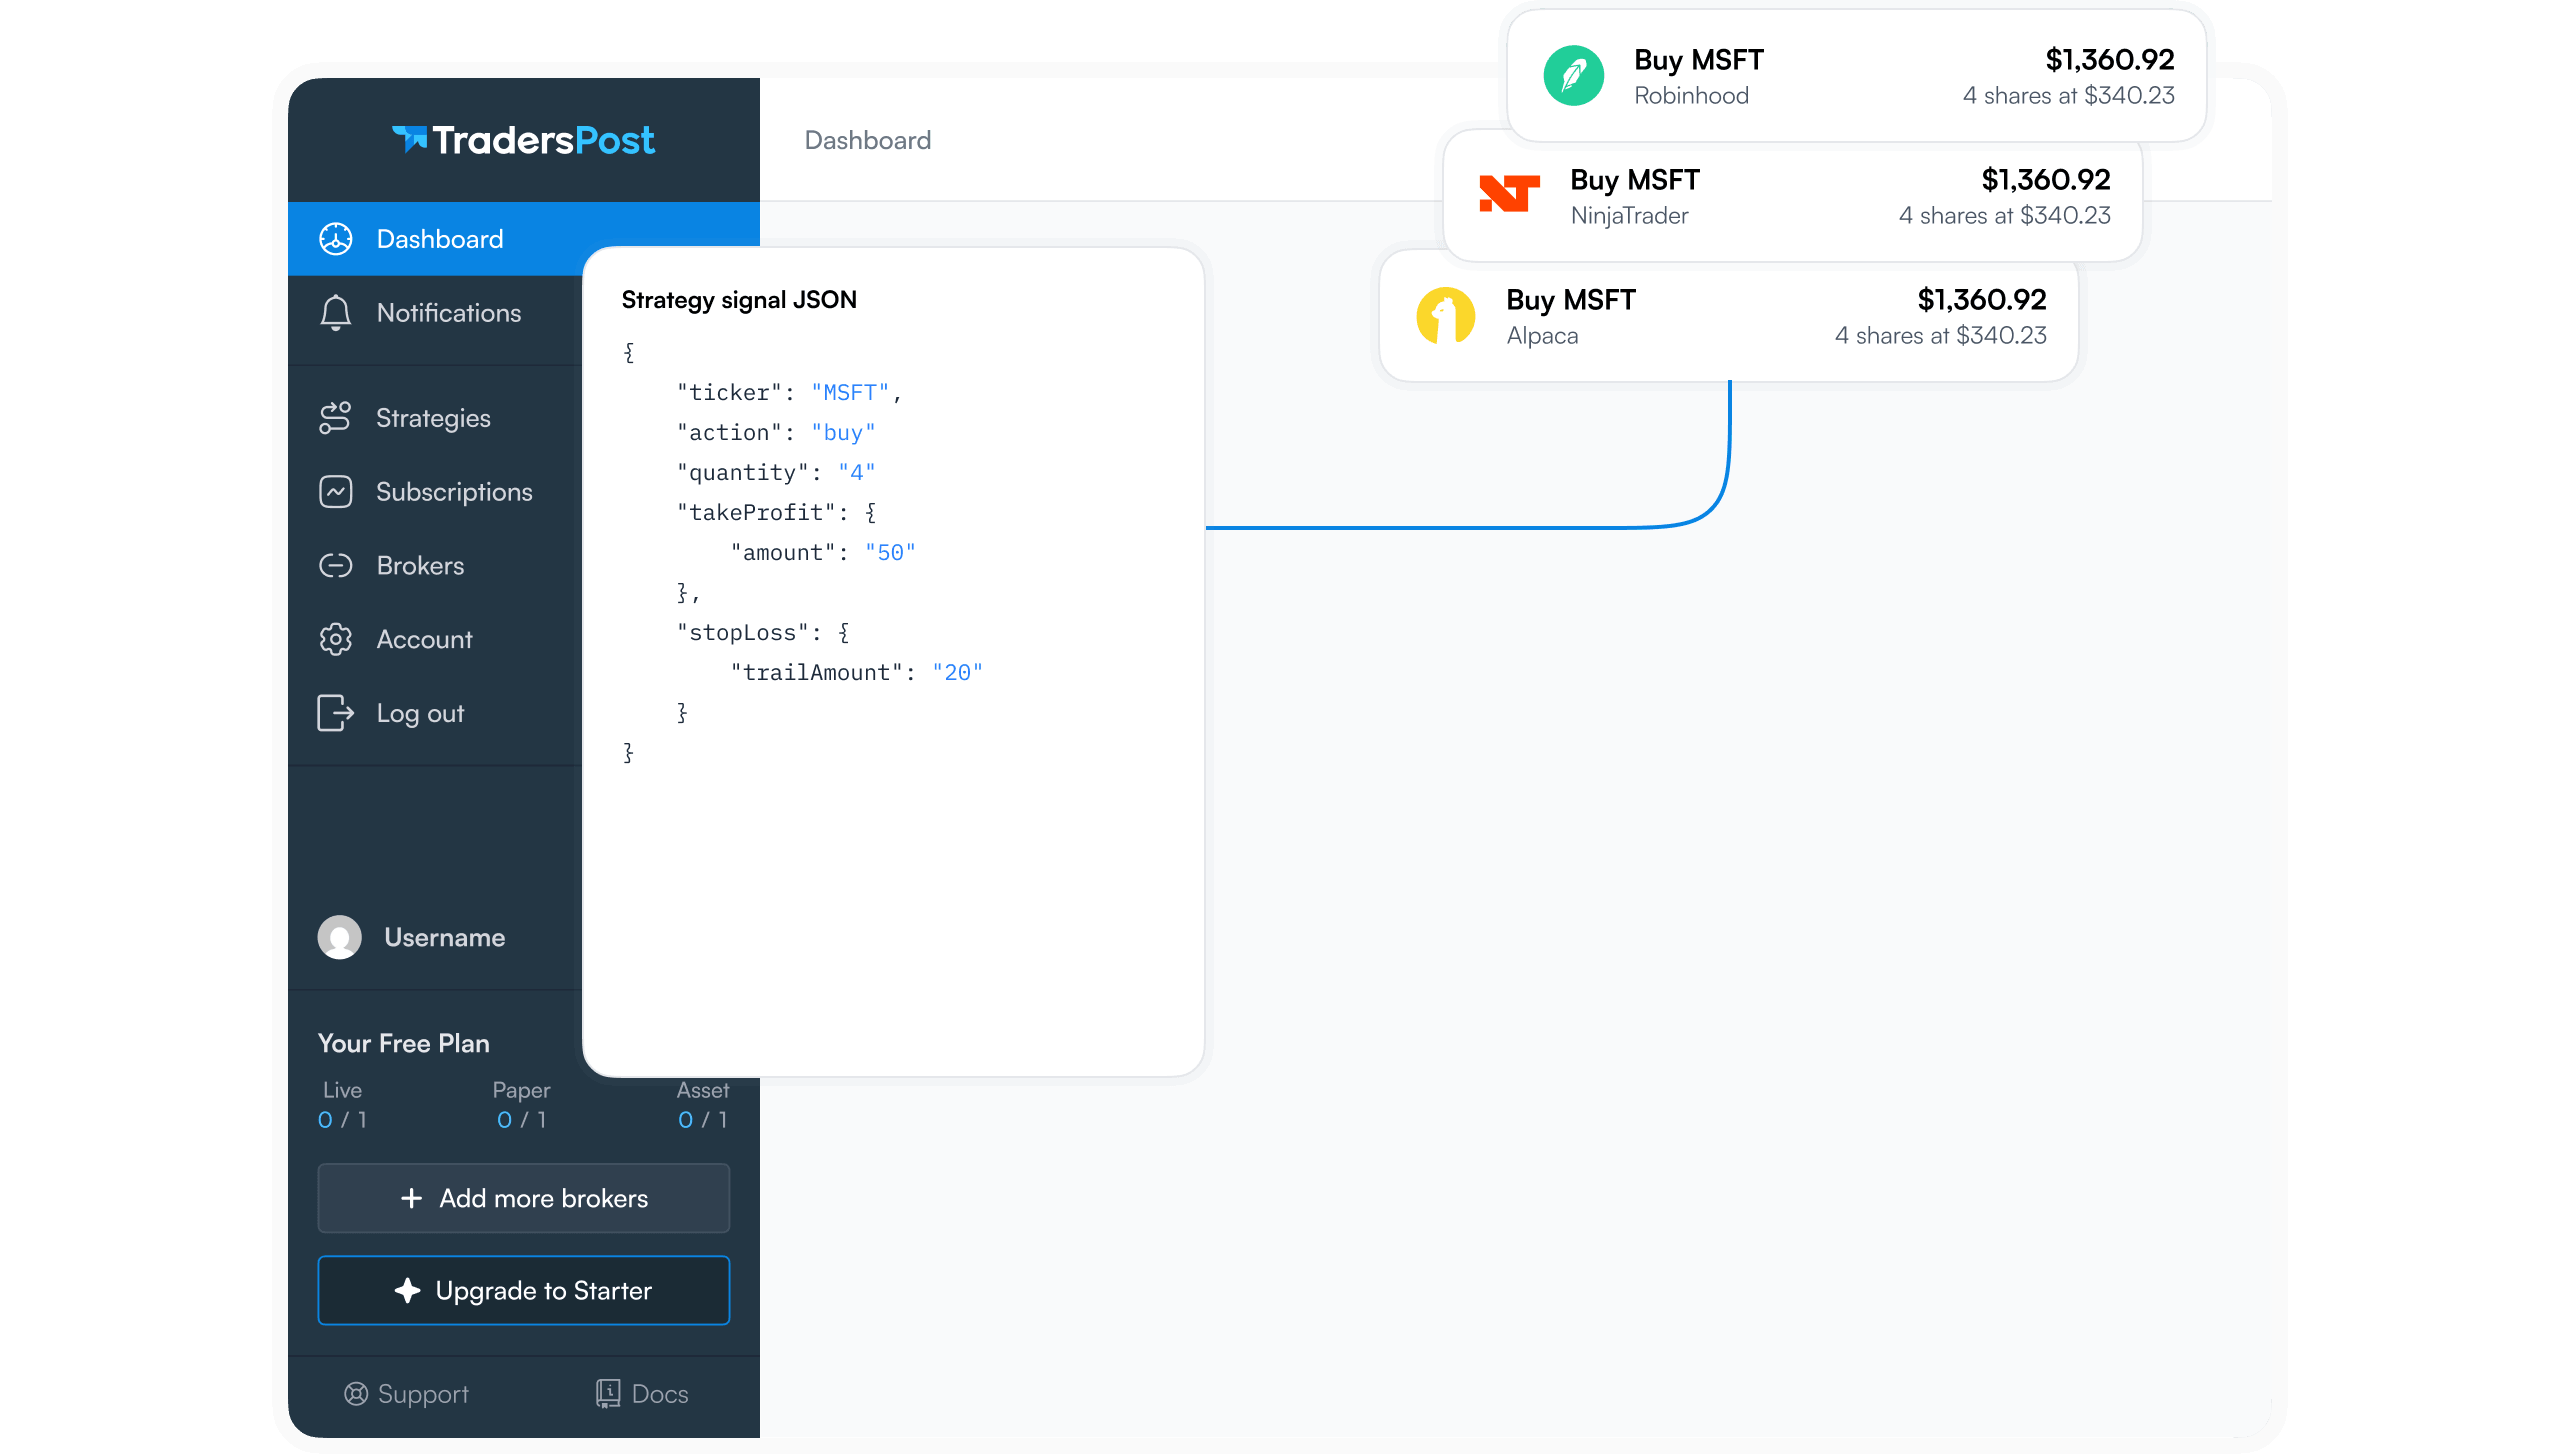
Store alert scripts, indicator inputs, symbol lists, and execution settings in version control. The live TradingView or TrendSpider alert must correspond to a named backtest version, including the same ADX threshold, ATR lookback, session rules, and stop methodology. TradersPost can then receive only qualified webhook alerts rather than every raw chart signal.4
Apply Position Sizing That Changes With Volatility
Fixed-share sizing is simple, but it creates inconsistent dollar risk. Buying 100 shares with a $0.50 stop risks $50 before slippage, while 100 shares with a $5 stop risks $500. Risk-based sizing ties quantity directly to the tested loss budget and stop distance.5
Position size = maximum dollars at risk ÷ stop distance per share or unit.
For example, if a $100,000 account has a $500 maximum risk allocation per trade and the entry is $50 with a protective stop at $47.50, the stop distance is $2.50. The initial size is 200 shares ($500 ÷ $2.50). Apply a separate notional cap if needed, such as no single equity position exceeding 10% of account value.
In high-volatility meme-stock or crypto regimes, reduce the risk allocation itself. A strategy that normally risks 0.50% of equity per trade might use 0.25% when ATR percentile exceeds 90 or when spread and gap risk exceed tested assumptions. Do not increase size because of a recent winning streak unless that adaptive rule was explicitly tested across comparable regimes.
Build Safeguards for Automated Orders
Configure TradersPost and broker-side protections to reject orders that violate portfolio-level constraints. At minimum, enforce maximum position size, maximum concurrent open positions, a daily realized-loss limit, duplicate-entry prevention, and approved trading windows. A duplicate-entry rule should block a second long alert for the same symbol while an existing long position or unfilled entry order remains active.
- Set a maximum of five open positions and no more than 20% of account equity in correlated crypto exposures.
- Stop new entries after a 2% daily realized loss, while allowing existing protective exits to remain active.
- Restrict opening orders to tested hours, such as 9:35 a.m. to 3:30 p.m. Eastern for U.S. equities.
- Attach the tested exit structure: fixed stop-loss, profit target, trailing stop, end-of-day exit, or maximum-holding-period exit.6
Automation enforces the tested rule set consistently, but it does not eliminate operational risk. Review broker order behavior, webhook logs, partial-fill handling, symbol mappings, market halts, and rejected orders. Maintain monitoring and a documented kill-switch process for data errors, connectivity failures, or behavior outside the tested regime assumptions.
Create a Go-Live Plan and Re-Test When Regimes Change
Move From Paper Trading to Small Live Risk
Move to live trading only after the paper-trading run satisfies criteria defined before the test began. For an automated options strategy, those criteria might include at least 40 to 60 paper trades across multiple volatility conditions, realized paper slippage within a specified tolerance, no order-routing failures, and drawdown remaining below the validated out-of-sample maximum. A strategy that performs well in a single quiet month has not earned production capital.
Begin with reduced exposure, such as 10% to 25% of the intended allocation or one contract per signal for defined-risk spreads. Keep the production configuration identical to the paper configuration at launch: use the same indicators, regime classifier, alert thresholds, position-sizing rules, stop logic, trading windows, broker order types, and order workflow. This creates a valid comparison between paper and live results. If live fills are materially worse than modeled, investigate execution assumptions before changing the signal logic.
- Do not scale after a few profitable trades. Require a meaningful live sample, such as 30 to 50 completed trades, plus compliance with the strategy drawdown limit.
- Scale in predefined increments. For example, increase from one to two contracts only after live expectancy, fill quality, and maximum drawdown remain within approved ranges.
- Log every exception. Record rejected orders, partial fills, delayed alerts, stale quotes, manual overrides, and broker API interruptions.
Monitor Regime Drift With a Weekly Scorecard
A weekly scorecard should compare current conditions with the ranges observed during development, validation, and paper trading. Track realized volatility, implied volatility percentile, trend strength, trade frequency, win rate, average win and loss, average slippage, fill rate, and current drawdown. For example, a short-premium strategy tested primarily in a 15% to 30% VIX range should be reviewed if volatility remains above 40% or if bid-ask spreads expand beyond the modeled execution assumptions.
Define pause criteria in advance. Pause the system if cumulative drawdown exceeds the validated maximum by a stated margin, such as 25%, if signal frequency falls materially below expectation, if win rate or average trade expectancy deteriorates beyond statistical tolerance, or if the regime filter repeatedly classifies conditions as unsuitable. A trend-following system designed for persistent directional movement should not continue opening positions when trend strength remains below its minimum threshold for several weeks.
Re-test on a schedule, such as quarterly and after major structural changes in volatility, liquidity, index composition, or market hours. Do not re-optimize parameters after every losing sequence. Frequent reactive optimization is a direct path to fitting noise.
Use a Simple Regime-Testing Workflow
Apply the same workflow each time a strategy is developed or reviewed:
- Define objective regimes using measurable variables, such as volatility percentile, moving-average slope, breadth, correlation, or liquidity.
- Segment historical data by those regimes and test a baseline strategy with realistic commissions, slippage, assignment risk, and order-fill assumptions.
- Optimize narrowly, using a small number of economically justified parameters.
- Validate on out-of-sample data and, where possible, walk-forward periods.
- Paper trade the unchanged rules, then deploy small live risk with automated safeguards.
- Monitor the weekly scorecard, enforce pause rules, and re-test at scheduled intervals.
A robust automated strategy has explicit operating conditions and an explicit no-trade condition. If the regime classifier cannot identify a favorable environment, the correct automated action is often no order. Past performance, including results from 2026 event windows, cannot guarantee future results.
Frequently Asked Questions
What is backtesting market regimes?
Backtesting market regimes is the process of evaluating a trading strategy separately across distinct market environments, such as strong uptrends, high-volatility corrections, bearish declines, and choppy trading ranges. The goal is to understand where the strategy has a reliable edge and where it tends to underperform. This analysis can help you reduce position size, trade less often, or avoid certain conditions when the strategy’s historical risk-adjusted results are weak.
How do I identify a trending versus choppy market for a backtest?
Use pre-defined, measurable filters to classify market conditions before reviewing your strategy’s performance. Common tools include ADX readings, moving-average slope, ATR percentile, price distance from a moving average, and the frequency of moving-average crosses. For example, a rising ADX and upward-sloping moving average may define a trend, while frequent crosses and low ADX may indicate chop. Consistent definitions help reduce hindsight bias.
Should I use different strategy parameters for each market regime?
Potentially, but only when your regime rules are simple, objective, and validated with out-of-sample data. A trend-following strategy may need wider stops in volatile markets, while a mean-reversion strategy may work better in ranges. However, avoid creating many highly tuned versions of the same system. A small number of robust configurations is usually easier to test, automate, monitor, and maintain without overfitting.
Why should I paper trade after backtesting a strategy?
Paper trading verifies that your strategy works operationally in real time, not just on historical charts. It helps confirm that alerts, webhook payloads, order sizing, broker routing, stops, targets, and protective exits behave as intended. It can also reveal live-trading differences that a backtest may not fully capture, including spreads, slippage, overnight gaps, delayed fills, and missed or duplicate signals.
Can TradersPost automate regime-based trading strategies?
Yes. Traders can create regime-qualified entry signals in TradingView or TrendSpider and send alerts to TradersPost for rule-based execution. For example, an alert can trigger only when both your strategy setup and a defined trend, volatility, or range condition are present. Test the complete workflow in a paper environment first, including position sizing, stops, targets, broker connections, and position limits, before trading with real capital.
Conclusion
Backtesting market regimes helps turn broad strategy ideas into more practical rules for changing conditions. Rather than judging a system by one aggregate return, evaluate how it behaves in trending, range-bound, volatile, and risk-off environments. Focus on drawdowns, trade frequency, win-rate stability, position sizing, and the assumptions behind each regime filter. The goal is not to find a strategy that wins everywhere, but to understand when its edge is most reliable and when risk controls should take priority.
Take the next step with TradersPost: connect TradingView or TrendSpider alerts, test your automated order rules in a paper account, and review performance across multiple market regimes. Once the workflow and risk parameters are validated, consider a disciplined, small-scale live deployment. Build confidence through evidence, not optimism, and approach 2026 with a tested process ready to adapt.
References
1 TradersPost Docs, Paper Trading
2 TradingView Pine Script Docs, Repainting
3 QuantInsti, Walk-Forward Optimization
4 TradersPost Docs, TradingView Signal Source
5 TradersPost Docs, Position Sizing
6 TradersPost Docs, Order Classes