Buy the Dip 2026: Retail’s Data-Driven Playbook
Buy the dip in 2026: analyze retail buying, define ATR, RSI, and moving-average entries, manage risk, and automate rules with TradersPost.

Marketing

Bottom Line
- Retail traders are advised to use Average True Range (ATR) to set realistic entry zones and stops, and Relative Strength Index (RSI) to identify momentum exhaustion for effective dip-buying in 2026.
- Persistent inflows into broad-index ETFs like S&P 500 and Nasdaq-100 can support shallow declines through systematic, diversified demand.
- High retail participation in dip-buying does not guarantee profitability, as flow data shows capital entry points but not the timing or management of positions.
- ATR-based strategies suggest defining a dip by volatility, with a potential dip flagged when price declines 1.0 to 1.5 ATR from a recent swing high.
- A systematic dip-buying rule should include measurable conditions such as price above the 200-day moving average, a pullback of at least 1.25 ATR, and RSI turning upward.
Retail traders bought nearly every meaningful pullback of the last cycle, but 2026 demands more than reflexive optimism. To buy the dip 2026 effectively, you need to distinguish a temporary discount from a trend break, quantify volatility before entering, and define exactly where your thesis is wrong. A dip that looks attractive on a daily chart can still become a damaging position if breadth weakens, momentum fails, or the market trades below key trend levels.
This playbook breaks down the data behind retail dip-buying behavior and turns it into a repeatable trading framework. You will learn how to use Average True Range (ATR) to set realistic entry zones and stops, Relative Strength Index (RSI) to identify momentum exhaustion, and moving averages to confirm whether a pullback remains within an uptrend. We will also cover position sizing, exit rules, and how to remove emotional decision-making by automating structured signals with TradersPost. The goal is not to catch every low, it is to take higher-quality pullback setups with controlled, measurable risk.
Buy the Dip in 2026: Why Retail Investors Are Stepping In
The 2026 Dip-Buying Trend: What the Data Should Show
The central question is not whether retail investors buy declines. It is whether persistent retail dip-buying has become a meaningful market stabilizer, or whether it has created crowded downside risk when a pullback becomes a sustained trend.
A credible 2026 answer requires more than social-media anecdotes or a single brokerage metric. Traders should triangulate retail-sensitive activity across Investment Company Institute ETF flow data, exchange-level Cboe options statistics, brokerage disclosures, and market-breadth measures such as advancing versus declining issues, new lows, and equal-weight index performance. These sources can show whether buyers are adding broad beta, concentrating in a few large names, or speculating at the margin.
- Broad-index ETFs: Persistent inflows into S&P 500, Nasdaq-100, and total-market ETFs can support shallow declines through systematic, diversified demand.
- Mega-cap technology: Dip-buying in a small group of index-heavy companies may lift cap-weighted benchmarks while breadth deteriorates.
- Crypto-linked equities: Flows into miners, exchanges, and treasury companies often reflect Bitcoin volatility and leverage appetite, not a general equity-market signal.
- Speculative small caps: Heavy call volume or rapid turnover can indicate risk-seeking, but it is a weak substitute for durable cash equity demand.
High retail participation does not imply high retail profitability. Flow data identifies where capital entered, not whether entries were timed well, positions were sized appropriately, or losses were controlled when prices continued lower.
Why Every Pullback Feels Like a Buying Opportunity
Repeated V-shaped recoveries condition investors to interpret a decline as temporary. Anchoring to a recent high makes a 2% index decline appear “cheap”; recency bias assumes the latest recovery pattern will repeat; fear of missing out turns an unfilled order into perceived opportunity cost. Social-media narratives can intensify conviction by presenting a popular ticker as an obvious bargain without defining invalidation, time horizon, or downside exposure.
A familiar pattern is not an edge until it becomes a measurable rule. Compare these two instructions:
- Discretionary: Buy the index after a 2% decline because it feels oversold.
- Rule-based: Enter a defined ETF position only after a 2% to 5% pullback, a close back above the 20-day moving average, positive five-day breadth thrust, and realized volatility below a preset threshold. Exit if the index closes below the pullback low, with position size scaled to volatility.
For automated traders, the second version is testable across regimes, including 2022-style persistent drawdowns rather than only bullish samples.
Is Retail Buying a Market Buffer or a Source of Risk?
Steady purchases of liquid index ETFs can add incremental demand during orderly pullbacks, particularly when volatility is contained, market breadth is stable, and institutional positioning is not aggressively defensive. In a range-bound or advancing market, this behavior can reinforce mean reversion.
The same behavior becomes fragile when liquidity thins, implied volatility rises sharply, breadth collapses, macro data changes the earnings or rate outlook, or leveraged positions face forced reduction. Concentrated call buying, margin-funded positions, and averaging down in correlated names can amplify a decline if dealers reduce hedges and investors sell simultaneously.
Build automation around market conditions, not the assumption that retail will always provide support. Require breadth, volatility, liquidity, and trend filters before activating a dip-buying strategy, and reduce exposure when those filters conflict. This is a framework for evaluating market structure, not a prediction that retail demand will prevent the next major drawdown.
What Counts as a Dip? Define It Before You Buy
A Percentage Decline Is Not Enough
A fixed percentage pullback does not have the same meaning across instruments. A 5% decline in a low-volatility index ETF may be an unusually deep correction, while a 5% decline in a volatile growth stock may be routine noise. In a leveraged ETF, the same decline may occur in a single session because daily leverage magnifies both gains and losses.
Before labeling any move a dip, define the complete rule set:
- Instrument: the specific ETF, stock, futures contract, or options underlying.
- Timeframe: intraday, daily, or weekly bars.
- Trend condition: for example, price above a rising 200-day moving average.
- Entry trigger: a percentage pullback, reclaim of a moving average, or reversal close.
- Stop and target: the exact invalidation level and exit logic.
- Maximum risk: a fixed percentage of account equity or volatility-adjusted dollar amount.
A testable daily ETF rule might be: buy only when the ETF is above its 200-day moving average and has pulled back 3% to 5% from its highest close of the prior 20 trading days. Require a close above the prior day’s high before entry, place a stop below the pullback low, and do not enter if that stop would exceed the strategy’s risk budget.
ATR-Based Pullbacks: Define the Dip by Volatility
Average True Range, or ATR, measures typical price movement over a selected lookback period. ATR allows an automated strategy to define a pullback relative to an instrument’s own volatility rather than applying the same percentage threshold to every ticker.
For example, in a confirmed uptrend, flag a potential dip when price declines 1.0 to 1.5 ATR from a recent swing high or from a short-term moving average. If a stock has a 14-day ATR of $4, a $4 to $6 decline is materially different from the same move in a $20 ETF with a $0.60 ATR.
ATR can also drive risk controls. A stop might sit 1.0 ATR below the entry or below the swing low, whichever is farther. Position size can then be calculated from the stop distance: a wider ATR-based stop requires fewer shares to keep dollar risk constant. Test ATR length, entry distance, and stop multiple separately by asset class and timeframe. Do not copy a 14-period ATR rule blindly across index ETFs, single stocks, and leveraged products.
Moving-Average Pullbacks: Buy Strength, Not Just Red Candles
A common trend-pullback framework requires price to remain above a rising 50-day or 200-day moving average, then retrace toward a 10-day, 20-day, or 50-day average. The moving average provides context for trend persistence, not a guaranteed support level.
A concrete setup is: price is above a rising 200-day moving average, pulls back to the 20-day EMA, then closes back above the 20-day EMA. An automated entry can trigger on the confirmation close or on a break above that bar’s high. The stop can sit below the pullback low, with position size adjusted to the distance.
Repeatedly buying below a falling long-term moving average is not necessarily buying a dip. It may be averaging into a persistent downtrend. Code trend filters explicitly rather than assuming every decline will mean-revert.
RSI Pullbacks: Oversold Is a Signal, Not a Buy Order
Relative Strength Index, or RSI, measures the balance of recent gains and losses on a bounded 0 to 100 scale. An RSI below 30 indicates recent downside momentum, not a confirmed bottom. In strong downtrends, RSI can remain oversold while price continues to decline.
A more selective trend-following rule might require: price above its 200-day moving average, RSI(14) falls below 35, then RSI crosses back above 35 while price closes above the 20-day EMA. This combines momentum recovery with trend confirmation.
Mean-reversion RSI systems and trend-following pullback systems are different strategies. A mean-reversion model may buy deeply oversold readings against short-term weakness, while a trend-pullback model waits for the broader uptrend and price confirmation. Test them separately, and combine RSI with volatility-based stops, trend filters, and defined maximum risk.
Systematic Dip Buying vs. Emotional Averaging Down
A Systematic Dip Entry Has a Defined Thesis
Systematic dip-buying means entering a long position only when pre-established market, price, indicator, risk, and sizing conditions align. The trade is not triggered simply because an asset is lower than yesterday. For an automated strategy, every condition must be measurable, testable, and executable without discretionary reinterpretation after the decline begins.
A complete dip-buying rule should specify:
- Eligible symbols: for example, SPY, QQQ, liquid sector ETFs, or stocks above a minimum average daily dollar volume threshold.
- Trend filter: such as price above the 200-day moving average and the 50-day moving average above the 200-day moving average.
- Dip definition: a pullback of at least 1.25 ATR from a 10-day high, or a specified percentage decline from a rolling high.
- Confirmation: RSI turning upward, a bullish close, reclaiming intraday VWAP, or a positive breadth signal.
- Entry order type: limit, stop-limit, market-on-close, or next-session opening order.
- Stop and profit-taking logic: a fixed ATR stop, swing-low stop, trailing exit, or predefined target.
- Maximum portfolio exposure: caps on position size, correlated ETF exposure, and total capital allocated to dip trades.
A sample checklist could require: SPY is above its 200-day moving average, price closes 1.25 ATR below its 10-day high, 14-period RSI turns higher from below 40, and risk per trade is capped at 0.5% of account equity. If any condition fails, the automation does not enter.
Emotional Averaging Down Changes the Plan Mid-Trade
Emotional averaging down is adding to a losing position because it is losing, without a preplanned price level, maximum number of entries, aggregate exposure limit, or invalidation point. It converts unrealized losses into a reason to increase risk.
Warning signs include widening a stop after entry, adding to a falling stock without a trend filter, concentrating capital in one name, and treating a lower price as evidence that the asset is more attractive. A lower price can reflect a deteriorating earnings outlook, broken technical structure, or a broad market regime change.
Planned scale-ins are valid when the full structure is defined before the first order. For example, a strategy may allocate three tranches of 25%, 35%, and 40% of intended exposure at 1.0, 1.75, and 2.5 ATR below a 20-day high, with one shared stop below the prior swing low. The total loss at that stop must remain within the original risk budget. This differs materially from buying another tranche after every additional 5% decline until capital is exhausted.
The Key Question: What Would Prove the Trade Wrong?
Invalidation is the condition that ends the thesis. It can be price-based, condition-based, or time-based: a daily close below the 200-day moving average, a 2 ATR stop from average entry, a breakdown below a defined swing low, or failure to recover within five trading sessions. The rule should be encoded before entry and evaluated consistently.
A stop does not need to identify the bottom or forecast the next reversal. Its function is to limit the cost of being wrong. Calculate position size from stop distance, not from a preferred share quantity. If a $100,000 account risks 0.5%, maximum trade risk is $500. With a $2.50 entry-to-stop distance, the maximum position is 200 shares, before accounting for slippage and commissions. This approach keeps a single failed dip trade from becoming a portfolio-level problem.
A Practical 2026 Buy-the-Dip Framework
Step 1: Start With Market Regime, Not the Individual Chart
A dip signal has different expected behavior depending on the broader market environment. Before an automated system evaluates an individual stock or ETF, classify the market regime and adjust buying aggressiveness accordingly.
- Bullish trend: Broad indexes are above rising long-term averages, breadth is healthy, and leaders continue making higher highs. Pullbacks to support can justify normal position size and faster entry rules.
- Range-bound market: Indexes oscillate around flat moving averages and sector leadership rotates frequently. Favor smaller targets, tighter time stops, and entries closer to established support.
- Bearish trend: Indexes trade below declining long-term averages, volatility expands, and breadth deteriorates. A dip may be the beginning of another leg lower, so reduce size, require stronger confirmation, or disable long dip entries entirely.
Useful regime inputs include the S&P 500 or Nasdaq-100 relative to its 200-day moving average, the slope of that average, volatility index direction, percentage of constituents above their 50-day moving averages, advance-decline measures, and sector leadership. For example, a technology stock pullback is more actionable when the Nasdaq-100 is above a rising 200-day average and semiconductors lead, than when breadth is weakening and defensive sectors dominate. Do not overfit a regime classifier to one historical period. Test it across calm bull markets, volatility shocks, range-bound years, and sustained declines.
Step 2: Use a Repeatable Entry Formula
Convert “buy the dip” into conditions an alert or execution script can evaluate consistently. One non-prescriptive example for a broad ETF is:
- The ETF is above a rising 200-day moving average.
- Price pulls back approximately 1 ATR toward the 20-day EMA.
- RSI recovers above 40 after the pullback.
- Price closes above the prior day’s high.
This formula combines trend, pullback depth, momentum recovery, and price confirmation. A trader may require every condition, simplify the rule set, or test alternatives such as volume confirmation or a sector-relative-strength filter. The critical discipline is not changing rules trade by trade after seeing the setup. Automation should calculate indicators from the same data source and timeframe, record every signal, and distinguish between signal generation and actual fill price.
Order selection affects realized results. Market orders prioritize immediate execution but can produce poor fills during rapid reversals. Limit orders can target a pullback level but may not fill if price turns early. Stop orders above a trigger price can require confirmation, but gaps can cause execution materially above the intended entry. Model slippage and gap risk explicitly, particularly around CPI releases, FOMC decisions, earnings, and other high-volatility news events.1
Step 3: Size the Position Before the Alert Fires
Position size should be determined from defined account risk, not conviction. A basic calculation is:
Maximum position size = account risk per trade ÷ (entry price − stop price)
For a $50,000 account with a 0.5% risk cap, maximum planned loss is $250. If entry is $100 and the protective stop is $97.50, per-share risk is $2.50. The maximum position is therefore 100 shares ($250 ÷ $2.50), before fees and expected slippage.2 An automated order system should round quantities appropriately and reject trades when the stop distance or liquidity makes risk limits impractical.
Apply portfolio controls as well: cap correlated exposure, limit the number of simultaneous dip trades, and set a daily loss limit that disables new entries after a predefined drawdown. Five long semiconductor positions are not five independent trades. Individual stocks, leveraged ETFs, and crypto-related instruments typically require smaller sizing because their ATR, overnight gap risk, and correlation during stress periods can rise sharply.
How to Automate a Buy-the-Dip Strategy With TradersPost
Build the Signal in TradingView or TrendSpider
Use TradingView or TrendSpider to identify the dip conditions, then use TradersPost to receive webhook alerts and route orders through a supported broker connection.3 The charting platform should decide when the setup exists. TradersPost should decide how to translate that approved signal into an executable order.
For example, a TradingView strategy might define a buy-the-dip entry as: price remains above the 200-period moving average, RSI(14) falls below 35, and price closes back above the prior bar’s high. A TrendSpider alert could use a comparable combination of trend filters, automated trendlines, Fibonacci levels, or multi-factor technical conditions created in its strategy and alert tools.
- Define the indicator and price conditions precisely.
- Create an alert that triggers only after the intended bar-close or intrabar condition occurs.
- Send the alert to the TradersPost webhook URL using the payload required by the configured strategy.
- Verify that the alert fires once, at the expected time, for the expected symbol.
Document every setting: chart timeframe, eligible symbols, moving-average lengths, RSI threshold, pullback percentage, session rules, alert frequency, and whether signals are evaluated intrabar or only at candle close. A 5-minute RSI signal during regular trading hours is not the same strategy as a daily-bar signal that can trigger in extended hours.
Turn the Strategy Into Explicit Order Rules
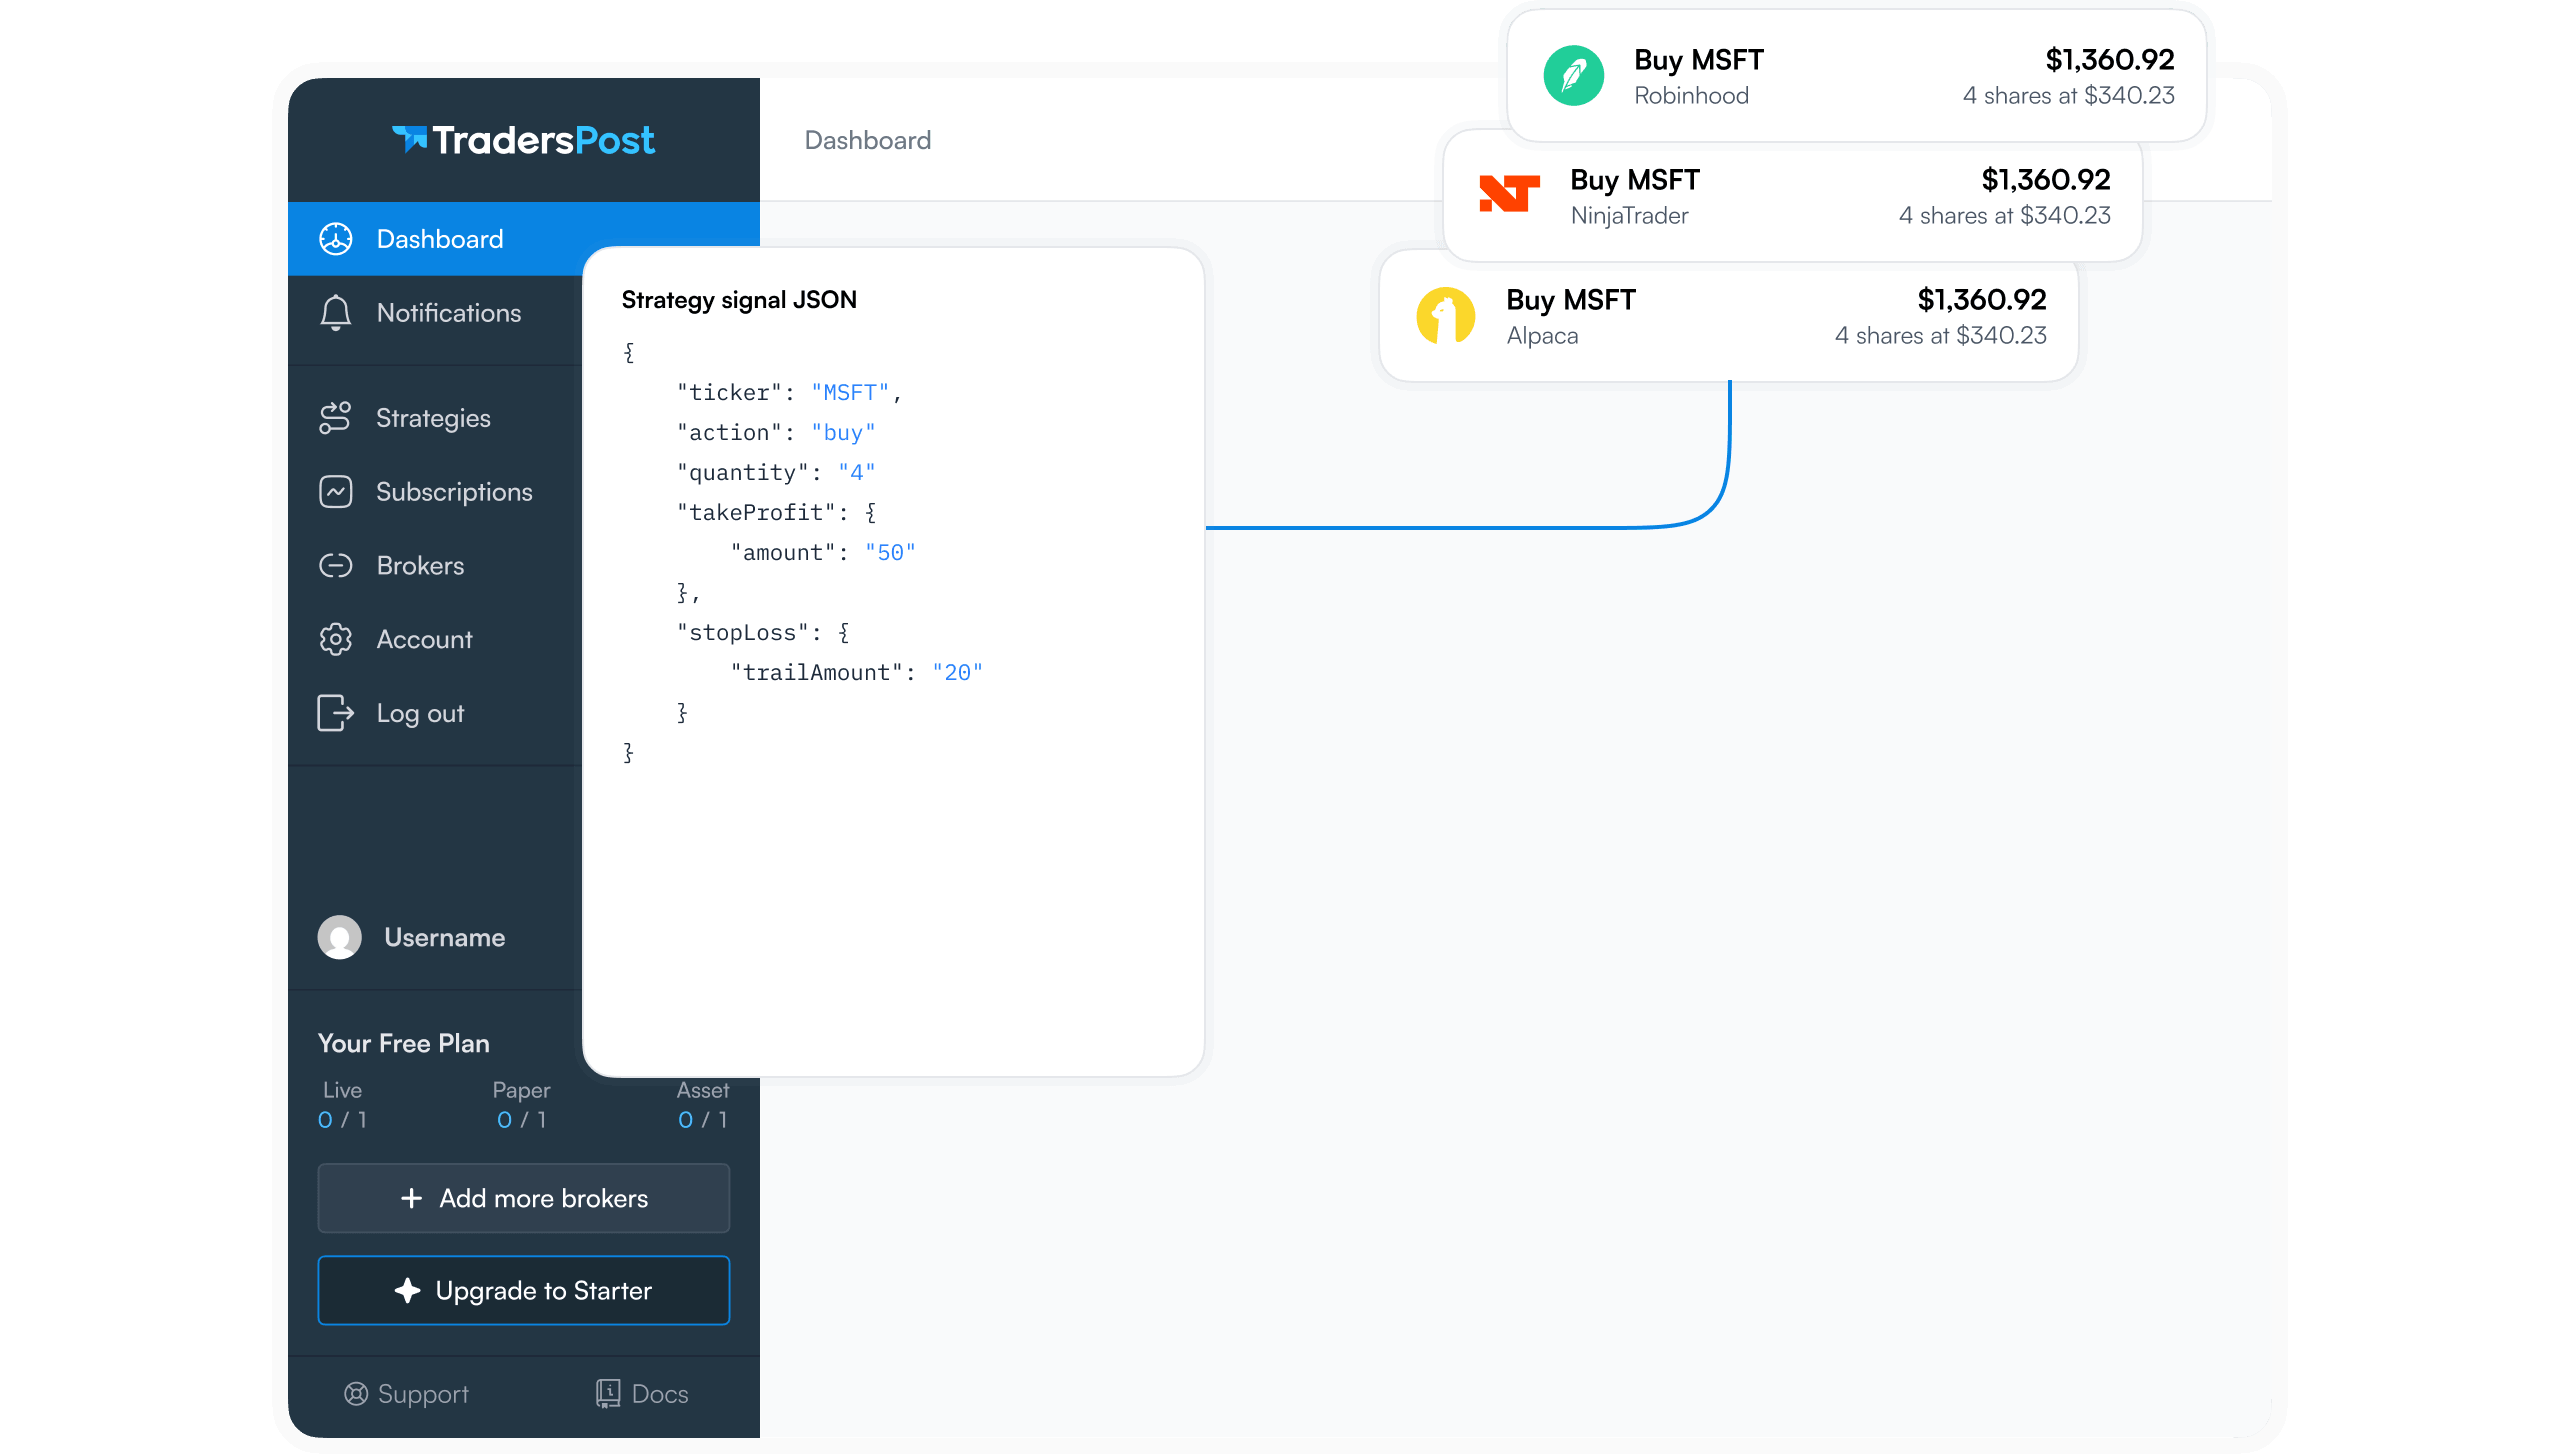
An automation rule needs complete order instructions, not a discretionary message such as “buy the dip now.” Each alert should communicate a machine-readable action and the strategy should define the remaining execution parameters: ticker, buy or sell action, quantity or sizing method, order type, applicable limit or stop price, and exit logic.
For example, an alert payload might identify SPY, a buy action, and a fixed quantity or dollar-based position size. The TradersPost strategy can then apply the associated order rules, such as a market entry, a limit order at a specified price, a protective stop, and a profit-taking exit.4 Use the payload structure configured for your TradersPost strategy and test it before relying on it.
- Set a maximum position size per symbol and across the account.
- Define whether pyramiding is prohibited, limited, or permitted.
- Reject duplicate entries when an existing long position is already open.
- Set a cooldown, such as no additional entry for 30 minutes after a fill.
- Specify exits independently, including stop-loss, profit target, time stop, or reversal signal.
Automation executes the rules provided. It does not correct vague signals, infer risk limits, or improve a poorly defined dip-buying strategy.
Paper Test Before You Risk Capital
Backtesting and paper trading answer different questions. A backtest evaluates how defined historical rules would have performed under stated assumptions.5 Paper trading validates the real-time operational chain: alert timing, webhook formatting, order routing, sizing, exit handling, and duplicate-alert behavior.6
Run the complete workflow across multiple symbols and market regimes, including trending selloffs, range-bound markets, high-volatility sessions, and gap-down opens. Log every alert with its timestamp, symbol, signal price, intended order, actual paper fill, and exit result. Compare expected fills with actual fills, then review whether your backtest slippage and commission assumptions remain credible.
Before live deployment, confirm that a repeated webhook cannot create an unintended second position, that rejected orders are visible, and that exit orders behave correctly during partial fills or rapid price changes. Paper results do not guarantee live results. Live execution can differ because of spreads, liquidity, latency, slippage, broker outages, and changing market conditions.
Risk Scenarios Retail Dip Buyers Should Plan For
The Dip That Becomes a Downtrend
A dip-buying model is designed for mean reversion, not for buying every lower price. A normal pullback can become a trend breakdown when the market receives new information that changes expected cash flows, discount rates, or risk appetite. Common catalysts include broad earnings estimate cuts, weaker employment or consumer data, inflation surprises, policy changes, credit stress, forced deleveraging, or a sudden liquidity shock.
Trend filters and predefined invalidation levels matter most when market character changes. For example, a strategy that buys an ETF after a 3% to 5% decline may require price to remain above a rising 100-day moving average, market breadth to stay above a specified threshold, and realized volatility to remain below a tested limit. If the index closes below the trend filter while advance-decline data weakens and volatility expands, the setup may no longer qualify, even if the nominal drawdown looks attractive.
- Reduce trade frequency when fewer stocks hold above key moving averages or new lows accelerate.
- Scale position size down as realized volatility or implied volatility rises, rather than deploying the same dollar amount into a wider-risk environment.
- Use rule-based invalidation, such as exiting when price closes below a support level, trend filter, or maximum adverse-excursion threshold defined in testing.
- Allow no-trade outcomes. If the signal fails its entry, trend, liquidity, or volatility conditions, sitting in cash is a valid strategy result.
Overconcentration in Popular Retail Names
Retail dip buyers often crowd into the same visible stocks, sector ETFs, and themes: mega-cap technology, semiconductors, artificial intelligence infrastructure, cryptocurrency-linked equities, or leveraged index products. Separate tickers do not necessarily represent separate risks. During a broad risk-off move, stocks with similar factor exposures can decline together, especially when they share high valuations, high beta, or sensitivity to the same macro narrative.
For example, holding three semiconductor names may create one concentrated semiconductor bet rather than three independent dip trades. A chip designer, equipment manufacturer, and memory producer may have different businesses, but all can reprice sharply if demand expectations, export restrictions, inventory data, or capital-expenditure forecasts deteriorate.
- Set a maximum allocation per ticker, such as 5% to 10% of account equity, based on tested drawdown tolerance.
- Cap total exposure by sector and theme, for example, limiting semiconductor exposure to 15% of long equity capital.
- Measure total net long exposure across correlated positions, including ETFs, options, and shares.
- Program automation to reject new entries when a proposed trade would breach ticker, sector, theme, or portfolio-level limits.
Gaps, News Risk, and the Limits of Stops
A stop order is an instruction to sell after a trigger price is reached, not a guarantee of execution at that price. In a rapid decline or overnight gap, a stop-market order can fill materially below its stop level. Stop-limit orders control the minimum acceptable price but may not execute at all if the market gaps through the limit.
Event risk is especially relevant around earnings releases, central-bank decisions, inflation reports, employment data, regulatory actions, and company-specific announcements. A stock that closes at $100 with a $96 stop can open at $88 after disappointing earnings. The realized loss reflects available liquidity at execution, not the intended stop level.
If avoiding event exposure is part of the tested strategy, automate an event calendar filter that blocks new entries or reduces positions before known high-impact releases. Position sizing should also assume that gap losses can exceed modeled stop losses. No automation stack eliminates market risk, execution risk, connectivity failures, stale data, order-routing problems, or broker-related risk. Test fail-safe behavior, monitor live orders, and maintain clear procedures for manual intervention.
Buy the Dip in 2026: A Rules-First Conclusion
Retail Conviction Is Not a Trading Plan
Elevated retail dip-buying can affect short-term price behavior, particularly in liquid index ETFs, mega-cap equities, and heavily traded options names. Persistent inflows may slow a selloff, support a reclaim of intraday levels, or increase demand for short-dated calls after a sharp decline. That behavior is market context, not a standalone edge. A trader who buys simply because “retail always buys the dip” has no defined invalidation point, no expectancy estimate, and no basis for distinguishing a routine pullback from the early stage of a larger trend reversal.
A rules-first dip strategy defines the complete trade before the order is sent:
- Market context: For example, trade only when SPY is above its rising 50-day moving average and the VIX is below a specified threshold.
- Dip threshold: Require a measurable decline, such as a 2% to 4% pullback from a five-day high, or a move to the lower Keltner Channel.
- Confirmation trigger: Enter only after price closes back above the prior day’s high, reclaims VWAP, or produces a defined reversal signal at support.
- Stop and position size: Risk a fixed fraction of account equity, such as 0.25% to 0.75%, with the stop placed below the setup’s structural low rather than at an arbitrary dollar amount.
- Exit rule: Specify whether the trade exits at a prior high, a fixed multiple of initial risk, a time stop, or a trailing indicator.
Track outcomes by setup type. Separate broad-index pullbacks from single-stock earnings dips, trend-continuation entries from oversold mean-reversion entries, and low-volatility pullbacks from high-volatility liquidation events. Record win rate, average win, average loss, maximum adverse excursion, holding period, and slippage. Memorable recoveries and painful failed dips are not evidence. A categorized trade log is.
Use Automation to Enforce the Plan, Not to Chase the Market
Automation is most useful when it removes discretionary errors from a tested process. It can scan for qualified pullbacks, calculate position size from stop distance, place bracket orders, prevent duplicate entries, and alert the trader when volatility or liquidity conditions invalidate the setup. It should not be used to repeatedly average down, override stops, or deploy new rules during a selloff because the market “looks too cheap.”
Use a staged implementation process:
- Historical test: Test one precise rule across multiple market regimes, including 2020-style volatility, 2022-style bear-market rallies, and lower-volatility trend periods.
- Paper test: Run the strategy in real time to validate signal timing, data quality, order handling, and assumed fills.
- Limited live deployment: Start with small size and compare live slippage, commissions, and execution quality against the backtest.
- Ongoing review: Review trades monthly, not emotionally after each loss, and change parameters only through a documented research process.
A practical next step is to build one simple rule: buy SPY only when it is above its 50-day moving average, closes at least 2% below its 10-day high, then reclaims VWAP the following session; place a stop below that session’s low and target 2R. Test that rule, document its behavior, and automate only the components you can verify. Do not attempt to automate every dip, every ticker, and every market condition at once.
Frequently Asked Questions
What does “buy the dip” mean in 2026?
Buying the dip means entering an asset after its price declines, expecting the price to recover. In 2026, it should be treated as a rule-based strategy concept rather than an automatic response to every red candle. A complete buy-the-dip plan defines the broader market trend, the size or type of pullback, the entry trigger, stop-loss level, and position size. Without those rules, buying a dip can quickly become an unplanned bet on a falling market.
How much of a decline counts as a dip?
There is no universal percentage that defines a dip because volatility varies widely between stocks, crypto, ETFs, forex, and other assets. Traders may define a dip using an ATR-based move, a pullback to a moving average, a percentage decline from a recent high, or an RSI-based condition. The most useful definition is one tested on the specific asset and timeframe you trade. What qualifies as a normal pullback in one market may signal a major breakdown in another.
Is buying the dip the same as averaging down?
No. Planned scaling into a buy-the-dip trade can be systematic when entry levels, total position size, stop loss, and maximum acceptable loss are set before the first order. Emotional averaging down happens when a trader keeps adding to a losing position without a predefined risk limit or invalidation point. The key difference is whether additional entries follow a tested plan. If you cannot state your maximum exposure and exit condition in advance, you may be averaging down rather than executing a strategy.
Can I automate a buy-the-dip strategy with TradersPost?
Yes. You can create qualifying alerts in TradingView or TrendSpider and send webhook signals to TradersPost for automated execution through supported broker connections. Your strategy should use explicit entry conditions, position-sizing rules, and risk controls instead of vague instructions such as “buy when price falls.” Before using real capital, paper test the entire alert-to-order workflow, including entries, exits, stop orders, and sizing. Also verify current TradersPost integrations and supported broker capabilities before deployment.
Should I wait for confirmation before buying a dip?
Confirmation can reduce the odds of buying into a decline that continues, but it often creates later entries and may reduce potential reward. The right choice depends on your strategy, market regime, stop distance, and backtested or forward-tested results. Some traders buy at predefined support levels, while others wait for a reversal signal, reclaim of a moving average, or momentum shift. For a deeper framework, see our related comparison of buying immediately versus waiting for confirmation.
Conclusion
Buying the dip in 2026 is not about reacting to every red candle. It is about defining what qualifies as a pullback, confirming whether the broader trend remains intact, and managing risk before placing an order. ATR can set volatility-aware entry zones and stops, moving averages can frame trend context, and RSI can help identify stretched short-term conditions. The edge comes from applying these signals consistently, with position sizing, exits, and market-regime filters built into the plan.
Turn the framework into a repeatable process: create a defined ATR, moving-average, or RSI dip-buying alert in TradingView or TrendSpider, connect it to TradersPost, and paper test the full execution workflow before trading live. Validate your rules across different market conditions, refine the weak points, then take the next step with confidence. Build your systematic dip-buying process today.
References
1 Federal Reserve, FOMC Meeting Calendar
2 TradersPost Docs, Position Sizing
3 TradersPost Docs, TradingView Signal Source
4 TradersPost Docs, Order Classes
5 TradingView, Pine Script Repainting & Backtesting Limits
6 TradersPost Docs, Paper Trading