Over-Optimization in Pine Script: Robust Strategies
Avoid over-optimization in Pine Script with out-of-sample tests, walk-forward analysis, and realistic TradingView strategy validation before live trading safely.

Marketing

Bottom Line
- Over-optimization, or curve-fitting, occurs when a Pine Script strategy is adjusted to fit historical data too closely, often leading to failure in live trading due to reliance on historical noise.
- Testing 10 entry lengths, 10 exit lengths, 5 trend-filter settings, 4 session windows, 5 stop-loss values, 5 profit targets, and 3 confirmation choices can create 150,000 possible strategy combinations, increasing the risk of fitting to past noise.
- Common symptoms of a curve-fit strategy include extremely narrow optimal settings, dependence on a small number of outcomes, and misleading win rates that do not account for risk-adjusted performance.
- Data snooping occurs when historical results influence strategy design decisions, leading to a polished backtest that may not be tradable; maintaining a research log can help mitigate this risk.
- In Pine Script v6, traders must ensure that entries and exits use information available at the decision point to avoid repainting risks, which can overstate backtest performance.
-
Traders ask whether they can inspect a restricted Pine Script, so the guidance now explains that unavailable source code removes TradingView's Source code control.
A Pine Script strategy can produce a near-perfect backtest and still fail the moment market conditions change. That gap usually comes from over-optimization Pine Script users unknowingly build into their indicators and strategies: too many parameter tweaks, filters selected from hindsight, and rules tailored to a small slice of historical price action. A high win rate, smooth equity curve, or impressive profit factor means little if the system only works because it was engineered around past noise.
This guide explains how to identify curve-fitting before it reaches your live account. You will learn how to separate in-sample development from out-of-sample validation, use walk-forward analysis to test whether parameters remain effective over time, and apply realistic TradingView assumptions for commissions, slippage, position sizing, and order execution. We will also cover practical signs that a strategy is too fragile, including excessive parameter sensitivity and performance concentrated in one market regime. The goal is not to find the most attractive historical backtest, but to build a strategy with evidence that it can survive conditions it has not yet seen.
What Is Over-Optimization in Pine Script?
Why a Great Backtest Can Fail in Live Trading
Over-optimization, also called curve-fitting, occurs when a Pine Script strategy is adjusted until its rules and inputs explain historical price behavior exceptionally well, including random price noise that has no repeatable value. The resulting backtest can show impressive net profit, win rate, or profit factor, yet fail quickly when live conditions differ from the historical sample.
A backtest is a historical simulation, not evidence that a strategy will deliver similar results in future live trading. It uses prices that are already known and may contain market conditions that do not repeat, such as a one-time volatility spike, a sustained trend, or unusually favorable gaps.
For example, a trader may test a moving-average crossover strategy and repeatedly alter the moving-average length, RSI entry threshold, and stop-loss percentage. After hundreds of combinations, they find that a 17-period moving average, RSI above 53, and a 1.4% stop-loss produces an unusually strong result on one chart. That result may reflect a genuine premise, but it may also be the one combination that happened to align with historical fluctuations. If performance deteriorates materially when those inputs are changed slightly or market conditions shift, the strategy was likely fitted to the past rather than built for the future.
The Difference Between an Edge and Historical Noise
An edge is a logical, testable market premise. For example, a trend-following system may assume that liquid instruments showing sustained relative strength can continue moving in the same direction long enough for a defined entry and exit process to capture part of the move. A credible edge should remain reasonably effective across multiple market periods, symbols, and nearby parameter values.
Historical noise is price behavior that looked useful in the test but has no durable explanation. Noise can include one-off price moves, an unusual market regime, isolated earnings events, temporary liquidity conditions, or favorable entry timing that may never recur. A strategy with many adjustable inputs has more ways to fit this noise accidentally. Each extra filter, threshold, lookback period, and exit rule increases the number of possible combinations that can appear successful by chance.
Write down the market hypothesis before reviewing optimization results. Define what the strategy is intended to exploit, why the setup should occur, which instruments it should apply to, and what conditions should invalidate it. This prevents backtest statistics from becoming the only decision criterion.
Common Symptoms of a Curve-Fit Strategy
- Extremely narrow optimal settings: A strategy performs well with a 17-period moving average but degrades sharply at 16 or 18. Robust systems usually tolerate modest input changes without collapsing.
- Dependence on a small number of outcomes: The equity curve relies on a few unusually large trades, one exceptional market year, or results from a single symbol.
- Misleading win rate: A 90% win rate can still be poor risk-adjusted performance if the occasional losing trade is much larger than typical winning trades.
Evaluate more than total return. Compare maximum drawdown, trade count, average trade, profit factor, win rate, and consistency across periods and symbols. A lower-return strategy with stable results across multiple tests is generally more credible than a spectacular backtest supported by fragile settings or a handful of outlier trades.
Why TradingView Optimization Can Lead to Overfitting
Too Many Inputs Create Too Many Chances to Fit the Past
Every adjustable Pine Script input creates additional strategy variations that can be tested against the same historical data. This is not inherently wrong, but the number of combinations grows rapidly. A strategy with an entry length, exit length, trend-filter length, session filter, stop-loss percentage, take-profit percentage, and one or two confirmation rules can easily produce thousands of possible configurations.
For example, testing 10 entry lengths, 10 exit lengths, 5 trend-filter settings, 4 session windows, 5 stop-loss values, 5 profit targets, and 3 confirmation choices creates 150,000 possible combinations. One of those combinations may show an exceptional net profit, profit factor, or drawdown profile simply because it happened to align with noise in that specific symbol and date range. That result is not evidence of a durable trading edge.
Limit inputs to variables that have a direct connection to the market hypothesis. If the premise is that an index trend improves long mean-reversion trades, a trend filter may be justified. Adding several unrelated oscillators, candle patterns, and narrow session exclusions merely because they improve a backtest is a warning sign.
- Start with a small parameter set: use only the settings required to express the entry, exit, risk, and timing logic.
- Prefer stable parameter regions: a strategy that performs similarly across nearby values is generally more credible than one that only works at a single setting.
- Reject unexplained rules: every filter should answer a specific question about market behavior.
The Hidden Risk of Repeatedly Checking Results
Data snooping occurs whenever historical results influence the next design decision. If a trader changes an entry rule, stop-loss percentage, trading session, or confirmation condition after viewing the Strategy Tester, the same data set is being used both to create and evaluate the strategy. Repeating that process enough times can produce a polished historical equity curve without producing a tradable system.
Manual testing is not safer than systematic optimization. Clicking through inputs, reviewing trades, and retaining only the attractive settings is still optimization when many variations are reviewed. The practical risk is often greater because discretionary changes are harder to track and easier to rationalize after the fact.
Maintain a research log for each test. Record the original market idea, parameter ranges, symbols, date range, timeframe, evaluation metrics, and every rejected variation. Include why a version was rejected, such as excessive drawdown, dependence on one year, poor trade count, or weak performance across symbols. Once the rules are selected, freeze them before evaluating a reserved out-of-sample period. Do not revise the strategy based on that reserved period, or it ceases to be out of sample.
Pine Script v6 Bar Behavior and Repainting Risks
A historical backtest can overstate performance when signals rely on information that would not have been confirmed when the trade decision was made. In Pine Script v6, traders must distinguish between values available only after a bar closes and values that can change while a real-time bar is forming. A signal that appears reliable on completed historical bars may behave differently intrabar in live conditions.
Verify that entries and exits use information available at the actual decision point. If a strategy is intended to enter only after bar close confirmation, its logic should wait for confirmed bars rather than react to a moving intrabar value. If it is intended to react intrabar, test with realistic assumptions about when the order can be generated and filled.
Higher-timeframe data requires particular care. A higher-timeframe candle can remain incomplete while lower-timeframe bars continue to print, so its indicator values may change until that candle closes. Avoid using future higher-timeframe values or settings that make a historical chart appear to know an unfinished higher-timeframe result. Review TradingView’s repainting documentation and inspect whether signals shift, disappear, or move after bars close.1 A robust automated strategy should generate the same actionable signal from information that was genuinely available when the decision was made.
Build a Test Plan Before You Optimize
Start With a Clear Trading Hypothesis
Optimization should test a market premise, not search blindly for a profitable combination of inputs. Write the premise before changing lengths, thresholds, stops, or profit targets. A useful hypothesis identifies four elements: the market condition, entry logic, exit logic, and the reason the behavior could persist.
- Trend-following example: Pullbacks to a moving average may produce higher-quality long entries when a market is in a persistent uptrend, because temporary selling pressure is absorbed by continuing directional demand. Enter after a pullback confirms, then exit on a trend failure or a defined profit objective.
- Mean-reversion example: Short-term extremes may revert more reliably in range-bound conditions, because price repeatedly moves away from and back toward an established value area. Enter after an oversold or overbought extreme, then exit near the range midpoint or opposite boundary.
Do not add an indicator simply because it improves net profit in one historical sample. If the indicator does not improve the explanation for why an entry should work, it is likely adding degrees of freedom rather than edge. Define the intended holding period and trading frequency early. A strategy designed to hold for three days has different execution, slippage, and risk assumptions than one attempting several intraday trades.
Choose Evaluation Metrics That Reflect Risk
Assess net profit with the statistics that explain how that profit was earned: maximum drawdown, profit factor, average trade, trade count, percent profitable, and the distribution of wins and losses. A high percent profitable can conceal occasional losses large enough to dominate the equity curve. Likewise, a strong profit factor based on a small number of trades may be random variation rather than evidence of a durable signal.
Set minimum standards before optimization. For example, require a trade count large enough to evaluate the setup across different market conditions, an average trade that remains meaningful after estimated costs, and a maximum drawdown that is acceptable relative to the expected return. The exact thresholds depend on the instrument and timeframe, but they should be established before reviewing parameter results.
The highest historical return is not automatically the best parameter set. Prefer parameter regions where nearby settings also perform reasonably well. A strategy that works only with one exact moving-average length, oscillator threshold, or stop value is more likely to be fitted to historical noise.
Use Realistic Trading Assumptions
Include commissions, expected slippage, and position-sizing assumptions in every test. A strategy with a $0.08 average trade may look attractive before costs but become untradeable after spreads, fees, and adverse fills. This is especially important for high-frequency entries, low-priced instruments, thinly traded markets, and systems targeting small intraday moves.
Test on the chart timeframe and market session that match the intended execution process. If alerts will be generated from a five-minute chart during regular trading hours, do not evaluate the logic primarily on daily bars or include overnight price behavior that the automation will not trade. Account for the practical limits of the market, including liquidity, spread, available trading hours, and the ability to enter or exit the intended position size.
Historical fills are simplified assumptions. Real-time alerts, order transmission, and brokerage fills can differ because prices move between the alert and execution. Build enough margin into the strategy’s average trade and risk controls to survive that gap rather than relying on idealized historical entries and exits.
Use In-Sample and Out-of-Sample Testing Correctly
Separate Development Data From Validation Data
In-sample data is the historical period used to design the Pine Script strategy, select inputs, and refine entry, exit, and risk rules. Out-of-sample data is a reserved historical period that is not used for parameter selection, rule changes, or threshold adjustments. Its purpose is to estimate how the strategy behaves on market information it did not effectively “see” during development.
A practical approach is a chronological 70/30 split. For example, if testing SPY from January 2016 through December 2025, develop the strategy on January 2016 through December 2022, then reserve January 2023 through December 2025 for validation. Keep the dates in order. Do not randomly shuffle bars, trades, or months between the two sets.
Randomization can be useful in other statistical contexts, but it is usually inappropriate for market time series. Financial markets are not independent, identically distributed observations. Volatility clusters, trends persist, correlations change, and liquidity conditions vary over time. Shuffling data can mix a low-volatility bull market with a high-volatility selloff, hiding the regime changes an automated strategy must withstand.
What Good Out-of-Sample Results Look Like
Out-of-sample performance does not need to replicate the in-sample equity curve or profit factor exactly. A credible result is directionally consistent: the strategy remains profitable or near its expected behavior, drawdowns stay within acceptable limits, and trade frequency does not collapse unexpectedly.
- Stable trade behavior: Similar setup frequency, average holding time, and win/loss distribution.
- Reasonable drawdowns: A larger drawdown may occur, but it should remain compatible with the strategy’s risk plan.
- Consistent rationale: A trend-following system should still benefit primarily during sustained directional moves, while a mean-reversion system should still perform best in orderly ranges.
Flag material deterioration. For example, a strategy that earns steadily in sample but becomes consistently unprofitable out of sample has likely been fitted to historical noise. Be equally cautious when the entire out-of-sample profit comes from one exceptional trade, one earnings gap, or one brief volatility event.
Do not retune moving-average lengths, RSI thresholds, stop distances, or Trading Windows after viewing out-of-sample results. Once you alter rules in response to that period, it becomes another in-sample set. Reserve a later, untouched period for a new validation pass.
Test Across Symbols and Market Regimes
Test the premise on related, liquid symbols rather than relying on one favorable chart. A breakout strategy developed on QQQ might reasonably be examined on SPY, IWM, or liquid sector ETFs. The expectation is not identical returns, but evidence that the underlying idea is not dependent on one instrument’s historical path.
Include periods containing bullish and bearish markets, high- and low-volatility conditions, persistent trends, and range-bound trading. A strategy does not need to work in every regime. It should, however, have defined failure conditions. For instance, a trend-following strategy may be expected to lose during repeated low-range reversals, while a short-term mean-reversion strategy may be vulnerable during sustained downside momentum.
Use these observations to form a testable hypothesis before adding complexity. If losses concentrate during extreme volatility, evaluate one simple volatility-based filter with a clear rationale. Do not respond by adding multiple conditional inputs until the backtest improves. More parameters usually increase the chance that the Pine Script strategy is fitting the past rather than identifying a repeatable market behavior.
Apply Walk-Forward Optimization to Pine Script Strategies
How Walk-Forward Optimization Works
Walk-forward optimization tests whether a Pine Script strategy can retain its edge as market conditions change. Instead of selecting settings from one large historical sample and validating them once, it uses a repeating sequence:
- Optimize strategy inputs on an initial historical window.
- Freeze those selected inputs and test them on the next, previously unseen window.
- Roll both windows forward and repeat the process across additional market periods.
A conventional in-sample/out-of-sample split can produce a misleading result if the single out-of-sample period happened to favor the strategy. Walk-forward testing evaluates stability across multiple validation windows, including different volatility regimes, trends, ranges, and liquidity conditions. As explained in this walk-forward optimization guide, the objective is not to identify a perfect parameter set. The objective is to determine whether the strategy development process remains viable over time when each selected configuration is exposed to data it did not influence.2
A Practical Walk-Forward Example
Assume a strategy trades a liquid futures contract or ETF using intraday Pine Script signals. Start by optimizing its inputs over the first 12 months of available data. Select settings using predefined constraints, such as minimum trade count, maximum acceptable drawdown, and a profit factor threshold. Then lock those settings and validate them on the following three months.
After that first validation period, move both windows forward by three months. For example:
- Cycle 1: optimize January through December, validate January through March.
- Cycle 2: optimize April through March, validate April through June.
- Cycle 3: optimize July through June, validate July through September.
The appropriate window length depends on trading timeframe, expected trade frequency, and the market behavior being tested. A strategy that generates only a few trades per month may need longer windows to produce a meaningful sample. A high-frequency intraday strategy may require shorter calendar windows, but still needs enough trades to evaluate performance reliably.
For every validation cycle, record the selected settings, out-of-sample return, maximum drawdown, number of trades, profit factor, and whether the strategy met predefined acceptance criteria. Review the full sequence rather than highlighting the best cycle. A strategy that produces moderate but acceptable results across six validation periods is usually more credible than one that has a single exceptional quarter surrounded by weak or failing periods.
Avoid Re-Optimizing Every Minor Market Move
Changing Pine Script inputs after every losing streak is usually reactive curve-fitting, not disciplined adaptation. Define a review cadence before trading begins, such as quarterly or after a specified number of completed trades. Do not evaluate a change until enough new market data and trades exist to distinguish normal variance from a genuine deterioration in behavior.
Require a documented reason for every adjustment. Valid reasons may include a sustained change in volatility, a structural change in session behavior, or evidence that the strategy’s trade distribution has materially shifted. A short-term drawdown alone is not sufficient evidence.
Before applying revised rules to automated execution, paper test them through the same alert and order workflow intended for live trading. Compare the revised version with the prior version over a defined period, then retain the change only if it improves robustness without violating the strategy’s drawdown, trade-frequency, or risk limits.
Robustness Checks Beyond Optimization Results
Perform Parameter Sensitivity Testing
Do not select a Pine Script input solely because it produced the highest historical net profit or profit factor. Test the values surrounding the apparent winner to determine whether the result is stable. For example, if a 20-bar breakout lookback produces the best result, evaluate a reasonable neighborhood such as 18, 19, 20, 21, and 22 bars. Extend the test far enough to understand the local behavior, but avoid searching hundreds of unrelated combinations until something looks attractive.
A robust parameter region resembles a broad plateau: several nearby settings produce acceptable drawdown, trade count, and return characteristics. A fragile result resembles a sharp peak, where 20 bars performs exceptionally well but 19 and 21 bars deteriorate materially. The sharp peak is often evidence that the setting is fitted to incidental historical price behavior rather than a persistent market effect.
- Compare net profit, maximum drawdown, profit factor, win rate, and number of trades across neighboring values.
- Prefer settings that remain acceptable across multiple values and test periods.
- Favor a stable setting with slightly lower historical returns over the single best-ranked value if the stable setting has less variation in results.
Stress Test Execution Assumptions
Backtest performance must survive assumptions that are less favorable than the historical model. Increase assumed commissions and slippage beyond the broker's advertised minimum, especially when testing liquid but fast-moving instruments.3 For short-term strategies, a small deterioration in entry or exit price can eliminate the entire expected edge.
Test practical disruptions: enter one bar later, assume a portion of signals are missed, or reduce the fill quality on stop and market-style entries. If the strategy relies on narrow targets, frequent reversals, or very short holding periods, model whether delayed entries turn profitable trades into losses. Also remove or reduce several of the largest winning trades. A system whose performance collapses when three or five exceptional trades are excluded has concentrated payoff risk.
- Recalculate results with higher slippage and commission assumptions.
- Test delayed entries and less favorable fills on the most execution-sensitive trade types.
- Review whether profitability, drawdown, and average trade remain sensible after reducing the best trades.
A strategy that works only under ideal fills, immediate signal handling, and minimal costs is not ready for real-money automation.
Review Trade Distribution Instead of Only the Equity Curve
A smooth cumulative equity curve can conceal fragile trade-level behavior. Inspect the individual trades to determine whether returns are distributed across many observations or dominated by a few outsized winners. A strategy with 200 modestly profitable trades has a different risk profile from one where five trades generate most of the total return.
Separate long and short results when the strategy trades both directions. A combined equity curve may look robust while long trades create nearly all profits and short trades add drawdown. Review performance by month, quarter, market regime, and symbol. For example, a trend-following system may appear strong overall but derive most gains from one highly directional quarter or one symbol with unusually persistent momentum.
- Measure the contribution of the top 5% and top 10% of trades to total profit.
- Compare long and short win rate, average trade, drawdown, and trade count separately.
- Identify periods, regimes, or symbols where the strategy consistently loses or produces no meaningful edge.
Robustness requires a repeatable distribution of outcomes, not merely an attractive historical equity curve.
Move From Pine Script Backtests to Controlled Automation
Validate Alerts Before Going Live
A historically robust Pine Script strategy still needs operational validation before it controls orders. When source code is unavailable for a published script, TradingView does not show the Source code control, preventing users from opening that code in Pine Editor7. A backtest evaluates the strategy’s historical decision logic, but automation depends on the alert being emitted at the intended moment and the resulting order instructions matching that decision.
Start by confirming alert timing. If the strategy enters only after bar-close confirmation, the TradingView alert must also be configured and triggered on bar close. An alert that fires intrabar can produce entries that the backtest never took. For example, a breakout condition may appear true halfway through a 15-minute bar, trigger an alert, and then disappear before the bar closes. The backtest may show no trade, while live automation entered one.
- Validate the strategy logic: confirm plotted entries, exits, stop conditions, and trade direction match the intended rules.
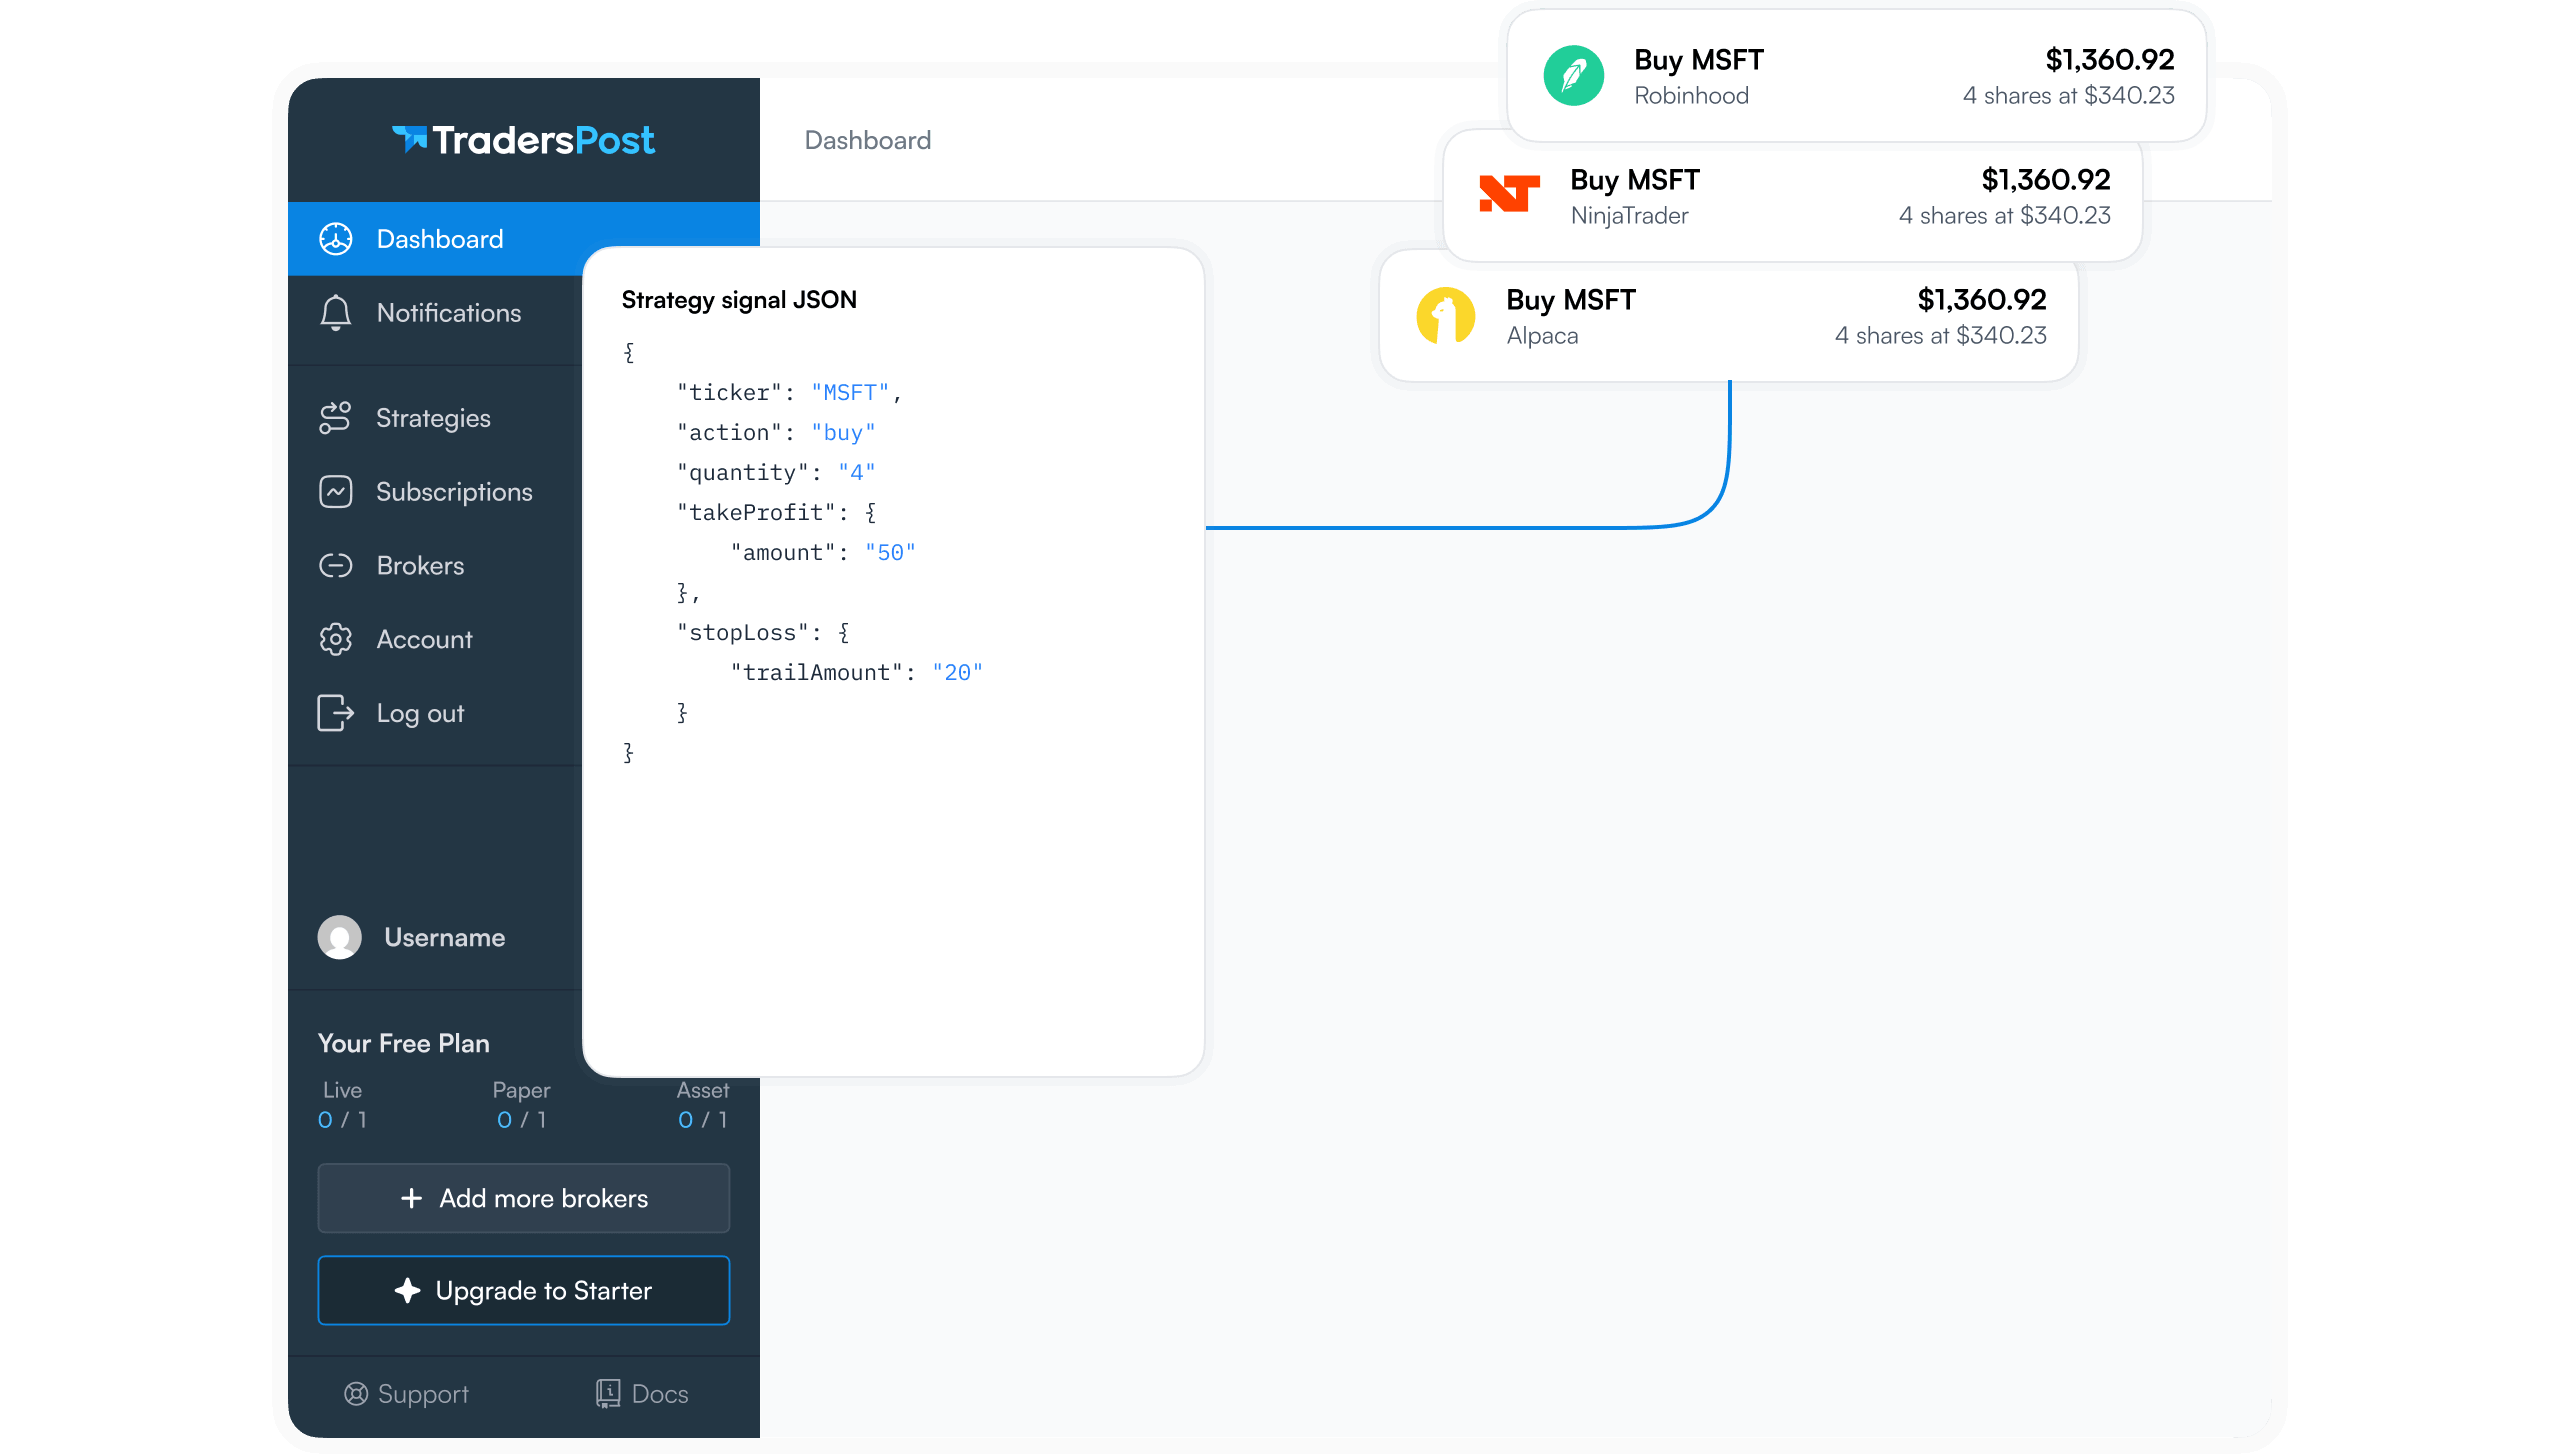
- Validate alerts: inspect alert messages and timestamps against the chart, including the ticker, action, quantity, takeProfit, and stopLoss instructions where used.4
- Test execution safely: use Paper trading or limited-risk execution where appropriate before assigning meaningful capital.5
- Monitor live behavior: compare each alert, order, fill, and exit with the corresponding chart signal.
Maintain a live-versus-backtested trade log. Record the signal time, alert time, entry price, exit price, position size, and reason for exit. This makes execution gaps visible, such as entries occurring one bar early, stops placed differently than expected, or exits that do not correspond to the tested rule.
Keep Live Strategy Rules Consistent With the Test
Do not treat a tested strategy as validated if its live implementation uses different position sizing, entry timing, exit rules, or trade direction. A change from fixed quantity to Percent of equity, a switch from bar-close entries to intrabar alerts, or the addition of a Trailing Stop changes the strategy’s return distribution and risk profile.6 It is a new strategy version that requires new validation.
Document the deployed version before enabling automation: tested rules, parameter ranges, symbols, timeframes, commission and slippage assumptions, sizing method, alert timing, and deployment date. If the system trades only during defined market hours, document the applicable Trading Windows as part of the ruleset.
Review performance periodically against the validation expectations. Focus on trade frequency, average win and loss, drawdown behavior, entry timing, and whether live results remain within a plausible range of the out-of-sample and walk-forward results. A deviation does not automatically prove failure, but it requires investigation before expanding risk.
A Simple Pre-Deployment Checklist
- Confirm the strategy has a written hypothesis, such as trend continuation after a volatility contraction, rather than an unexplained stack of indicators.
- Confirm backtests include realistic commissions, slippage assumptions, and enough trades across multiple market conditions.
- Confirm out-of-sample testing and walk-forward analysis were performed where practical.
- Confirm nearby parameter values remain acceptable. If only one RSI length, moving-average period, or stop distance works, the strategy is likely over-optimized.
- Confirm the script does not repaint or rely on unconfirmed higher-timeframe values that make historical signals appear cleaner than real-time signals.
- Confirm the TradingView alert and automated order instructions match the rules actually tested, including ticker, action, quantity, stopLoss, takeProfit, and expiration when applicable.
- Confirm alert timing matches the backtest, particularly for bar-close strategies.
Frequently Asked Questions
What is over-optimization in Pine Script?
Over-optimization occurs when a Pine Script strategy is tuned so closely to historical price movements that it captures random market noise instead of a durable trading edge. This usually happens after testing many indicator settings, filters, or entry rules until the backtest looks exceptional. While the historical statistics may appear impressive, the strategy often performs poorly in out-of-sample testing or live conditions because the patterns it relied on were not repeatable.
How can I tell if my TradingView strategy is overfit?
Common warning signs include one narrow parameter value producing great results while nearby values perform much worse, reliance on only a few unusually large trades, and weak out-of-sample performance. Test the strategy across multiple market periods, symbols, and reasonable parameter ranges. A more robust strategy should produce reasonably stable results rather than depending on a single “perfect” input setting or a specific historical market environment.
What is walk-forward optimization?
Walk-forward optimization is a testing process that repeatedly optimizes a strategy on one historical period, then evaluates it on the next unseen period. For example, you may optimize settings using six months of data and test them on the following month before rolling the process forward. This approach helps determine whether both the strategy and its parameter-selection process can adapt to changing market conditions without relying entirely on past data.
Can repainting make a Pine Script backtest look better than it is?
Yes. Repainting can make a Pine Script backtest appear stronger than real-time performance because historical signals may use values that were not confirmed or available when the trade would have occurred. Indicators based on higher timeframes, intrabar movement, pivots, or future-looking calculations deserve careful review. Follow TradingView’s repainting guidance and ensure entries, exits, and alerts use only information that would have been known at the actual signal time.
Should I use the best-performing optimized settings?
Not automatically. The highest-return setting in a backtest may simply be the one that best fit historical noise. Instead, look for a broad, stable region where several nearby settings produce acceptable results. Then validate your chosen settings with out-of-sample testing, walk-forward analysis, and realistic assumptions for commissions, slippage, spreads, and order execution. A slightly lower historical return with stronger robustness is often a better choice for live trading.
Conclusion
Over-optimization is rarely caused by a single bad setting. It usually emerges when a Pine Script strategy is repeatedly adjusted to fit historical noise, creating impressive backtests that fail when market conditions change. Robust development means prioritizing simple rules, realistic costs and slippage, non-repainting logic, out-of-sample validation, and testing across multiple market regimes.
Once a strategy demonstrates consistent behavior beyond its development sample, the next objective is disciplined execution. If you have validated a non-repainting, out-of-sample-tested TradingView strategy, connect its alerts to TradersPost and begin with a controlled automation workflow. Start with appropriate position sizing, monitor live performance against expectations, and refine only when evidence supports a change. Build confidence through process, not curve-fitting, and take the next step toward reliable automated trading.
References
1 TradingView, Pine Script Repainting
2 QuantInsti, Walk-Forward Optimization
3 TradingView, Strategy Properties (Commission & Slippage)
4 TradersPost Docs, Webhooks
5 TradersPost Docs, Paper Trading
6 TradersPost Docs, Position Sizing
7 tradingview.com, Primer / First steps