Pine Script Backtesting Limitations and Validation
Learn Pine Script backtesting limitations, from repainting and lookahead bias to fills, costs, and forward testing methods that improve validation results.

Marketing

Bottom Line
- Pine Script backtesting can produce misleading results due to assumptions about prices, timing, liquidity, and order behavior that may not match real market conditions.
- Key validation risks include repainting, lookahead bias, intrabar behavior, unrealistic fills, and omitted costs such as commissions and slippage.
- Pine Script v6 improves testing discipline but cannot make historical simulations identical to live execution, highlighting the importance of forward testing and paper trading.
- Repainting occurs when signals change after a bar closes, making it crucial to use confirmed-bar logic for more repeatable signals in backtests and live monitoring.
- Lookahead bias can occur when higher-timeframe data is used prematurely, leading to cleaner historical entries that are not achievable in real-time trading.
-
Traders ask how limit-order verification affects backtests, so the guidance now explains tick-based fill requirements and limit-price simulated fills.
A Pine Script strategy can produce an impressive equity curve while hiding assumptions that would fail in live trading. That gap is the core issue behind Pine Script backtesting limitations: TradingView evaluates historical bars using data and execution rules that may not match the prices, timing, liquidity, or order behavior available in real markets. A high win rate or smooth profit factor means little if the script accidentally uses future information, repaints signals, or assumes fills that could not realistically occur.
This post breaks down the validation risks that matter most, including repainting, lookahead bias, bar-close versus intrabar execution, stop and limit order fills, slippage, commissions, spread, and position-sizing assumptions. You will also learn how to inspect a strategy for overly optimistic logic, use realistic backtest settings, separate in-sample development from out-of-sample testing, and build a forward-testing process before committing capital.
The goal is not to make every backtest look worse. It is to identify which results are durable, which depend on favorable assumptions, and what evidence a Pine Script strategy needs before it earns your confidence.
Why Pine Script Backtests Can Mislead Traders
What a Strategy Tester Result Actually Represents
A TradingView Strategy Tester report is a historical simulation, not an execution record. Its trades are generated from the chart data available to the script, the strategy’s inputs and order settings, and TradingView’s assumptions about how orders could have filled within each bar. The resulting net profit, drawdown, win rate, and equity curve describe what the strategy would have done under those modeled conditions.
A strong historical equity curve is therefore evidence of a hypothesis, not proof that the same strategy will perform comparably in live markets. Historical bars are completed records. Live trading occurs while prices, volume, spreads, and signals are still changing, and an automated order must be accepted and filled by an actual broker or exchange.
The main validation risks are specific and testable:
- Repainting: a signal changes or disappears after later price data becomes available.
- Higher-timeframe data leakage: a lower-timeframe strategy effectively uses information from an incomplete higher-timeframe bar as though it were already final.
- Intrabar behavior: a bar’s open, high, low, and close do not reveal the exact sequence of price movements.
- Unrealistic fills: a simulated limit, stop, or market order receives a price that may not have been executable in real conditions.
- Omitted costs: commissions, spread, slippage, financing, and other trading frictions can materially change results.
Pine Script v6 Does Not Remove Market-Simulation Limits
Pine Script v6 provides tools and settings that can improve testing discipline, but no language version or platform setting can make a historical simulation identical to live execution. A script can be logically correct and still produce a backtest that overstates an executable result.
Traders should separate three different problems. First, script logic errors include repainting conditions or incorrect treatment of confirmed bars. Second, unrealistic backtest assumptions include optimistic stop fills, missing slippage, or entries modeled at prices unavailable after a signal is confirmed. Third, normal simulation-to-market differences arise even with sound logic: a live market order can fill later or worse than expected because of spread, liquidity, latency, and changing order-book conditions.
Use backtesting to form hypotheses, then validate those hypotheses with forward testing and Paper trading.1 For automation, the key question is not merely whether the chart shows a profitable trade, but whether the signal, alert, order submission, and executable fill remain viable under live conditions.
A Quick Example of an Overstated Backtest
Consider a 15-minute strategy that enters long when an indicator crosses above a threshold. On completed historical bars, the signal appears perfectly timed: the 15-minute candle closes strong, the strategy enters, and the next bars rise. In real time, however, the indicator may cross above the threshold early in the active bar, trigger an alert, then fall back below the threshold before the 15-minute bar closes. The apparent historical signal was only valid after the bar finished.
The report can look highly profitable when three assumptions combine: a changing intrabar signal, a favorable modeled entry or stop fill, and zero trading costs. A small apparent edge can disappear once entries are restricted to confirmed bars, fills are stressed with realistic slippage, and commissions and spread are included.
The validation checklist later in this article will test whether that apparent edge survives confirmed-bar logic, higher-timeframe safeguards, realistic order-fill assumptions, and cost-adjusted forward testing.
Repainting: Historical Bars vs. Real-Time Bars
Why Signals Can Differ After a Bar Closes
A Pine Script calculation on the current real-time bar is provisional. As each new trade changes the bar's price, high, low, and volume, conditions can become true, then false, before the bar closes. Once the bar closes, TradingView stores only the finalized OHLCV values. Historical bars are therefore evaluated using information that was not fixed while that bar was forming.
For example, a five-minute strategy may signal a long entry when price briefly crosses above a moving average at 10:02. If price falls back below the average by 10:05, the completed historical bar may show no crossover at all. A trader who observed or alerted on the intrabar event cannot reliably reproduce that signal after reloading the chart, because the historical calculation sees only the final bar state.
This distinction matters when a strategy, alert, or automation workflow acts on an unconfirmed condition. A backtest may display a clean sequence of entries based on closed bars, while live monitoring can observe temporary conditions that never appear on the final chart. Conversely, a historical signal can appear visually stable even though the live condition changed repeatedly during formation of the original bar.
TradingView documents this behavior as repainting and distinguishes between calculations on historical bars and updates on the real-time bar.2 Review the TradingView Pine Script v6 repainting documentation when evaluating any script that can respond before a bar is confirmed.
Use Confirmed-Bar Logic for More Repeatable Signals
When the objective is consistency between historical testing, alerts, and live monitoring, base entries and exits on confirmed bar-close conditions. A confirmed-bar signal evaluates the final values of the completed candle, which makes the condition far more reproducible after a chart reload and during forward testing.
The trade-off is timing. Waiting for the close can filter transient intrabar moves, but it can also produce a later entry or exit than an intrabar approach. For instance, a breakout condition may first occur near the high of a 15-minute candle, but a confirmed-bar design waits until that candle closes before recognizing the breakout. That delay is not necessarily a flaw. It is the cost of using finalized data.
- Bar-close design: Use when repeatability and auditability are primary requirements.
- Intrabar design: Use only when the strategy explicitly intends to react during bar formation and has been validated under those conditions.
- Documentation: State clearly whether every entry, exit, stop, or reversal is intended to occur at bar close or may occur during the bar.
If alerts are used to initiate automated orders, this distinction should be explicit in the strategy specification. Do not assume that a signal visible on a completed chart represents the exact condition that existed at every moment during the live bar.
Test the Same Signal in Replay and Real Time
Validate signal stability with a structured forward-test log. For every alert, record the timestamp, symbol, alert price, timeframe, direction, and whether the bar was still forming or confirmed. Then reload the chart after the relevant bars have closed and compare the real-time observations with the signal locations shown historically.
Use Bar Replay to inspect how the condition develops as candles form, but also monitor the script in real time during a meaningful forward-test period. Specifically, look for signals that move to a different bar, change direction, or disappear entirely after the chart reloads.
Any material mismatch is a validation issue, not a cosmetic charting difference. Resolve it before relying on the strategy for automated execution. The appropriate remedy may be confirmed-bar logic, revised alert timing, or a documented intrabar process with testing that measures the resulting behavior rather than the cleaner historical appearance.
Avoid Lookahead Bias in Higher-Timeframe Data
How Higher-Timeframe Requests Can Leak Future Information
Lookahead bias occurs when a historical backtest uses information that was not actually available when a trade decision would have been made. Higher-timeframe data is a common source of this error because a completed daily, weekly, or hourly bar contains prices, volume, and indicator values that developed over its entire interval.
For example, consider a strategy running on a 5-minute chart with a daily trend filter. The strategy may buy only when the daily moving average is rising or when the daily close is above a daily breakout level. On historical 5-minute bars, it can appear as though the final daily value was known throughout the trading session. In live trading, however, that day’s close, final volume, high, low, and any indicator derived from them are not known until the daily bar closes.
This can make historical entries appear unusually clean. A 5-minute entry may seem to trigger immediately after a daily trend reversal or daily breakout, even though the daily bar had not yet confirmed that condition at the time. The resulting backtest can show earlier entries, fewer false signals, and better prices than the strategy could realistically achieve in real time.
Use Confirmed Higher-Timeframe Values
The safer approach is to make lower-timeframe decisions using only higher-timeframe values that were confirmed when the lower-timeframe bar closed. For a daily filter applied to a 5-minute strategy, this generally means using the prior completed daily bar during the current session, rather than relying on the developing current daily bar.
Review each multi-timeframe input independently. A strategy can avoid lookahead in one trend filter while still leaking future information through another condition. Check all of the following:
- Higher-timeframe moving averages and trend states
- Daily, weekly, or hourly highs and lows
- Breakout, range, and support/resistance conditions
- Volume, relative volume, and volume-average filters
- Session-based indicators and end-of-session calculations
- Oscillators, volatility measures, and crossover signals calculated on a higher timeframe
Test the strategy with each higher-timeframe condition delayed until it is genuinely available. If performance changes materially when a daily value is delayed by one completed daily bar, the original result likely depended on information that would not have been known at entry time.
Audit Multi-Timeframe Strategies Before Trusting Results
Before using a multi-timeframe strategy for automation, perform a structured audit:
- Identify every higher-timeframe input: Include explicit filters and values indirectly used by indicators or entry logic.
- Define when each value becomes final: A daily close is final only after the daily session closes, while an hourly high is final only after that hour ends.
- Verify unfinished values are unavailable: Confirm that entries cannot use a developing higher-timeframe close, high, low, volume total, or derived indicator value as though it were final.
- Forward test the exact configuration: Compare live or paper results with the historical backtest using the same chart timeframe, symbols, sessions, and alert configuration.
Exceptionally smooth entries near daily, weekly, or hourly turning points are a warning sign. If a strategy repeatedly enters near the exact high, low, reversal, or breakout point of a higher-timeframe bar, investigate whether it is seeing the completed result before that bar actually closes.
For a detailed explanation of historical versus real-time behavior, review TradingView’s repainting documentation. Multi-timeframe validation should be completed before treating a Pine Script backtest as evidence that an automated strategy will behave similarly in live execution.
Intrabar Fills, Every-Tick Calculations, and Bar Magnifier
Why OHLC Bars Cannot Show the Full Price Path
A standard historical candle reports only four prices: open, high, low, and close. It does not report the exact sequence of prices inside the bar. This creates a critical ambiguity when a trade has both a stop-loss and take-profit order active.
For example, assume a long position entered at 100.00 on a 1-hour chart, with a stop at 99.50 and a target at 100.50. A completed candle may show an open of 100.00, high of 100.60, low of 99.40, and close of 100.10. Both exit levels were reachable, but OHLC data alone cannot establish whether price reached 100.50 before falling to 99.50, or whether the stop was hit first.
That distinction is not cosmetic. It can materially change reported win rate, average trade, profit factor, maximum drawdown, and total trade count. Strategies using tight stops and targets, especially on higher chart timeframes, are particularly exposed to same-bar fill assumptions.
The Mismatch From Calculating on Every Tick
Calculating on every tick can create a meaningful difference between live behavior and a historical backtest. During live trading, a condition may become true briefly in the middle of a bar, trigger an entry, and then become false before the candle closes. Historical evaluation often has less granular information and may evaluate the completed bar differently.
Consider a breakout rule that enters when price crosses above an intrabar level. In live conditions, price can trade above that level for several seconds, producing an entry. If price then reverses and closes below the level, a bar-close historical test may show no entry at all. The live trade existed, but the completed candle no longer reflects the condition that triggered it.
- Bar-close system: Generate signals only from confirmed completed bars, then test and automate using that same constraint.
- Intrabar system: Accept that entries and exits depend on movement inside the candle, then validate the logic with lower-timeframe evidence and conservative fill assumptions.
Do not treat these as interchangeable designs. A strategy that performs well only because of intrabar behavior should not be evaluated as though it were a bar-close system.
Use Bar Magnifier and Deep Backtesting Carefully
TradingView's Bar Magnifier can use lower-timeframe data, where available, to make intrabar order-fill assumptions more detailed.3 This can improve testing of stop-losses, targets, and other price-based exits that may occur within the same chart bar. Review the relevant settings in TradingView's strategy properties documentation.
Deep Backtesting can extend the historical range available for testing. However, additional bars do not repair flawed entry logic, lookahead errors, unrealistic slippage assumptions, or ambiguous same-bar exits. A longer test can increase confidence only after the underlying execution assumptions are credible.
Compare results with Bar Magnifier enabled and disabled. A large change in net profit, drawdown, win rate, or trade count is evidence that intrabar fill sequence matters. That result deserves investigation rather than selection of whichever setting produces the better equity curve.
Stress-Test Stops and Targets on Lower Timeframes
Test the strategy on a lower chart timeframe to determine whether its stops and targets remain plausible under more detailed price movement. If a 1-hour strategy uses a tight stop and target, inspect the 5-minute or 1-minute movement around representative trades. Determine whether price realistically reached the target before the stop, or vice versa.
This review is especially important when a strategy's profitability depends on frequent same-bar stop-and-target outcomes. If performance deteriorates substantially as price detail increases, the original backtest was relying on execution uncertainty. Treat the result as a hypothesis requiring further validation, not as definitive evidence that the automated strategy will perform as reported.
Add Realistic Commission, Slippage, and Fill Assumptions
Zero Costs Are a Major Default Backtest Problem
A backtest with zero commission and zero slippage measures a theoretical trading signal, not an executable strategy. This distinction matters most when the expected edge per trade is small. If a strategy earns an average of $0.08 per share before costs but routinely gives up $0.03 on entry and $0.03 on exit through commissions, spread, and adverse fills, its apparent historical edge is largely gone.
Frequent-trading strategies are particularly exposed because costs compound across a large number of round trips. Small-target mean-reversion, scalping, and short-duration breakout systems can also be highly sensitive because a few ticks of slippage may represent a meaningful percentage of the intended profit target. Even highly liquid instruments can experience poor fills during rapid price movement, at the open, near news releases, or when a stop order is triggered through a thin price level.
Do not treat costs as a single universal number. Actual execution depends on the broker, asset class, venue, order type, account pricing, bid-ask spread, available liquidity, position size, and market conditions. A market order, stop market order, and limit order have different execution risks. Large orders may also create market impact or receive partial fills, neither of which is fully captured by a simple historical chart simulation.
Configure Strategy Properties Before Evaluating Performance
Before judging a Pine Script strategy by net profit or profit factor, review its assumptions in TradingView Strategy Properties. At minimum, confirm the following inputs match a plausible live-trading scenario:
- Commission: Select the appropriate commission type and value for the intended broker and instrument.
- Slippage: Apply a conservative number of ticks to account for adverse execution, especially for market and stop-driven entries.
- Order size: Use a realistic fixed quantity, cash amount, or percentage-of-equity sizing assumption.
- Pyramiding: Ensure the permitted number of same-direction entries reflects the actual strategy design.
- Order-fill settings: Review assumptions affecting intrabar execution, limit-order fills, and whether orders can be processed on bar close.
- Initial capital: Set capital high enough to support the intended position sizing, drawdowns, and margin requirements.
Use assumptions that are slightly worse than your expected live conditions, not values chosen because they preserve an attractive historical equity curve. TradingView documents these settings in its Strategy Properties reference. TradingView's limit-order verification setting can require price to move beyond a limit price by a specified number of ticks before the broker emulator fills the order. The simulated fill remains at the limit price rather than the improved price7.
Run a Cost Sensitivity Test
Test whether the strategy has sufficient execution tolerance. First, run the backtest using a baseline commission and slippage estimate. Then rerun the identical test with higher, but still plausible, assumptions. For example, increase slippage from one tick to three ticks per order and raise the commission estimate to reflect a less favorable pricing tier or additional fees.
After each run, compare:
- Net profit
- Profit factor
- Average trade
- Maximum drawdown
- Percentage of profitable trades
A robust strategy should degrade gradually as execution assumptions worsen. If modestly higher costs turn net profit negative, collapse profit factor, or make the average trade negligible, the historical result likely lacks enough edge for automated live trading. Treat that outcome as a validation finding, not a reason to reduce the cost assumptions.
Build a Proper Pine Script Validation Process
Separate In-Sample Testing From Out-of-Sample Validation
A Pine Script strategy becomes overfit when its rules are repeatedly adjusted until the historical equity curve looks attractive. Each adjustment may appear justified, but the combined process can tailor entries, exits, filters, and position sizing to noise unique to the tested period. A strong backtest is not sufficient evidence if the same data was used to create every rule.
Define an in-sample period for development, such as January 2018 through December 2022. Use this period to establish the strategy logic, select sensible parameter ranges, and model commissions, slippage, and trading constraints. Then reserve a later out-of-sample period, such as January 2023 through December 2024, without reviewing or optimizing against it until the rules are finalized.
Evaluate both periods across distinct market regimes. For an equity index strategy, this should include sustained bullish conditions, sharp bearish declines, high-volatility reversals, and extended range-bound periods. A trend-following system may reasonably underperform in a tight range, but it should not produce losses that are inconsistent with its stated risk model. The goal is not identical results across periods, but similar behavior, drawdown characteristics, and trade quality.
Use Robustness Checks Instead of Chasing the Best Settings
Do not select a setting solely because it produces the highest net profit or profit factor. Test nearby values to determine whether the strategy has a stable operating range. For example, if a moving-average strategy performs well only with a 37-bar lookback, test 30, 35, 40, and 45 bars. If changing the length from 37 to 40 causes a severe deterioration, the result may be dependent on historical coincidence rather than a durable market effect.
- Test entry and exit parameters above and below the selected value.
- Test symbols that match the intended deployment universe, such as several liquid index ETFs rather than only one ticker.
- Test timeframes consistent with the expected holding period. A strategy intended for intraday automation should not be validated only on daily bars.
- Review trade count, maximum drawdown, average trade, and losing streaks, not just total return.
Robust strategies usually remain reasonable under modest changes to inputs, symbols, and timeframes. Overfit strategies often show a narrow cluster of profitable settings surrounded by poor outcomes. That pattern is a warning that the strategy may fail when live prices, fills, and market conditions differ from the historical assumptions.
Maintain a Trade-Level Validation Log
Maintain a trade-level log during Paper trading and early live validation. For every planned trade, record the signal timestamp, symbol, expected entry price, actual entry price, exit reason, expected costs, actual costs, and the discrepancy between the expected and actual outcome. Include whether the order used a Stop Market or other intended order behavior, where applicable.
- Was the signal confirmed at bar close, or did it change before confirmation?
- Were higher-timeframe inputs finalized when the signal was generated?
- Did the fill occur at the expected price range and time?
- Did the exit match the planned stop, target, expiration, or strategy reversal condition?
- Were commissions, spread, and slippage materially different from backtest assumptions?
This log converts vague concerns about backtest realism into evidence. If actual entries repeatedly occur after the modeled price, or higher-timeframe signals differ after confirmation, the issue can be measured, quantified, and addressed before capital is scaled.
Forward Test and Paper Trade Before Going Live
Why Forward Testing Is the Essential Next Step
Forward testing evaluates the strategy on market data that did not exist when you developed or optimized the Pine Script. This is the first meaningful test of whether the backtest reflects a repeatable process rather than a favorable historical fit.
Run the script in real time and record every expected signal, alert, and hypothetical fill. Forward testing can expose issues that are difficult to identify in the Strategy Tester, including:
- Repainting behavior: A condition that appears valid on a completed historical bar may disappear or change while the live bar is forming.
- Alert timing differences: An alert configured to trigger once per bar can behave very differently from one that triggers only after the bar closes.
- Missed or duplicate signals: Session filters, symbol-specific data issues, and state-dependent conditions can produce live behavior not evident in a historical review.
- Unrealistic fills and cost drag: The historical fill assumption may not reflect the bid-ask spread, slippage, commissions, or available liquidity when a signal occurs.
- Changing market conditions: A strategy optimized during a low-volatility trend may fail during choppy, high-volatility, or gap-prone conditions.
Define the forward-test period before starting. For example, a high-frequency intraday system may require at least 100 to 200 forward trades, while a daily swing strategy may need several months and a smaller trade count because signals occur less often. The goal is enough observations to evaluate execution and behavior across different conditions, not simply to accumulate a profitable sample.
Paper Trade the Complete Signal-to-Execution Workflow
Paper trading should validate the full operating process, not merely confirm that an arrow appears on a TradingView chart. Treat each signal as an operational event that must pass correctly from alert generation through the intended paper-trading workflow.
For every paper trade, verify the following:
- The alert identifies the correct ticker and maps to the instrument you intend to trade.
- The action matches the chart signal, including long entries, short entries, exits, and reversals.
- The quantity is correct for the selected sizing approach, whether fixed size, Percent of equity, or Risk percent.4
- Protective exits, including stopLoss, takeProfit, and a configured Trailing Stop, behave as intended.5
- The timestamp of each alert matches the intended bar-close or intrabar decision point.
Compare paper-trading results with the TradingView Strategy Tester, but do not assume they should match trade for trade. The Strategy Tester uses its own bar-based assumptions, while paper trading reflects the timing and sequence of actual alerts. Investigate material differences, especially entries that occur one bar late, exits that trigger at unexpected prices, or signals missing during designated Trading Windows.
Define Clear Criteria for Moving Beyond Paper Trading
Set objective validation criteria before the forward test begins. Suitable criteria include no unexplained alert behavior, correct symbol and direction on every trade, entry prices remaining within a predefined tolerance of the expected market price, and performance that remains viable after conservative estimates for spread, slippage, and commissions.
Compare forward-test results with conservative backtest expectations, not the most profitable parameter combination or best historical period. If the backtest projects a 55% win rate and a modest profit factor after costs, require the forward test to remain reasonably consistent with that baseline before considering live deployment.
After validation, begin cautiously. Use limited exposure and continue monitoring every signal. Paper conditions do not fully reproduce real liquidity, partial fills, gaps, or execution conditions, particularly around market opens, news events, and thinly traded instruments.
Pine Script Backtesting Limitations Checklist
Pre-Backtest Checklist
- Confirm intended signal timing. Decide whether the strategy is designed to act only after a bar closes or intrabar while the bar is still forming. A moving-average crossover confirmed at the 5-minute close is not equivalent to an intrabar crossover that can disappear before close.
- Review higher-timeframe inputs for future-data leakage. Any daily, weekly, or other higher-timeframe value used on a lower chart timeframe must be available at the moment the lower-timeframe signal occurs. For example, a 15-minute strategy should not use the final daily high before the trading day has completed.
- Set conservative execution assumptions. Apply commission, slippage, order sizing, and fill logic that match the instrument and order type. A liquid ETF may tolerate modest slippage assumptions, while thin options, small-cap equities, and fast futures markets require wider assumptions. Do not treat a stop price as a guaranteed fill price.
- Document the test environment. Record the exact symbol, chart timeframe, session definition, date range, and whether extended-hours trading is included. Results on regular-session SPY 5-minute bars cannot be assumed to represent 24-hour futures or premarket equity trading.
Post-Backtest Checklist
- Compare Bar Magnifier results. When entries, stops, or targets can occur within the same chart bar, run the strategy with and without Bar Magnifier. Material differences indicate that intrabar price path assumptions are driving the reported performance.
- Test robustness, not just the best setting. Separate in-sample and out-of-sample periods, then evaluate nearby parameter values. If a strategy only works with a 21-bar lookback and fails at 20 or 22, its apparent edge may be curve-fitted.
- Stress test costs. Increase commission and slippage beyond the optimistic baseline. A strategy that earns 0.08% per trade before costs may be untradable if profitability disappears under slightly worse fills.
- Inspect individual trades. Review the largest winners, largest losses, and bars where both a stop and target were reachable. Verify that the assumed fill sequence is plausible for the available intrabar data.
Forward-Testing Checklist
- Validate real-time behavior. Confirm that live alerts follow the intended confirmed-bar or intrabar design. A strategy intended to wait for bar close should not send an actionable alert during an unfinished bar.
- Maintain an execution log. Record alert time, expected trade, Paper trading result, and any discrepancy between the backtest assumption and observed execution.
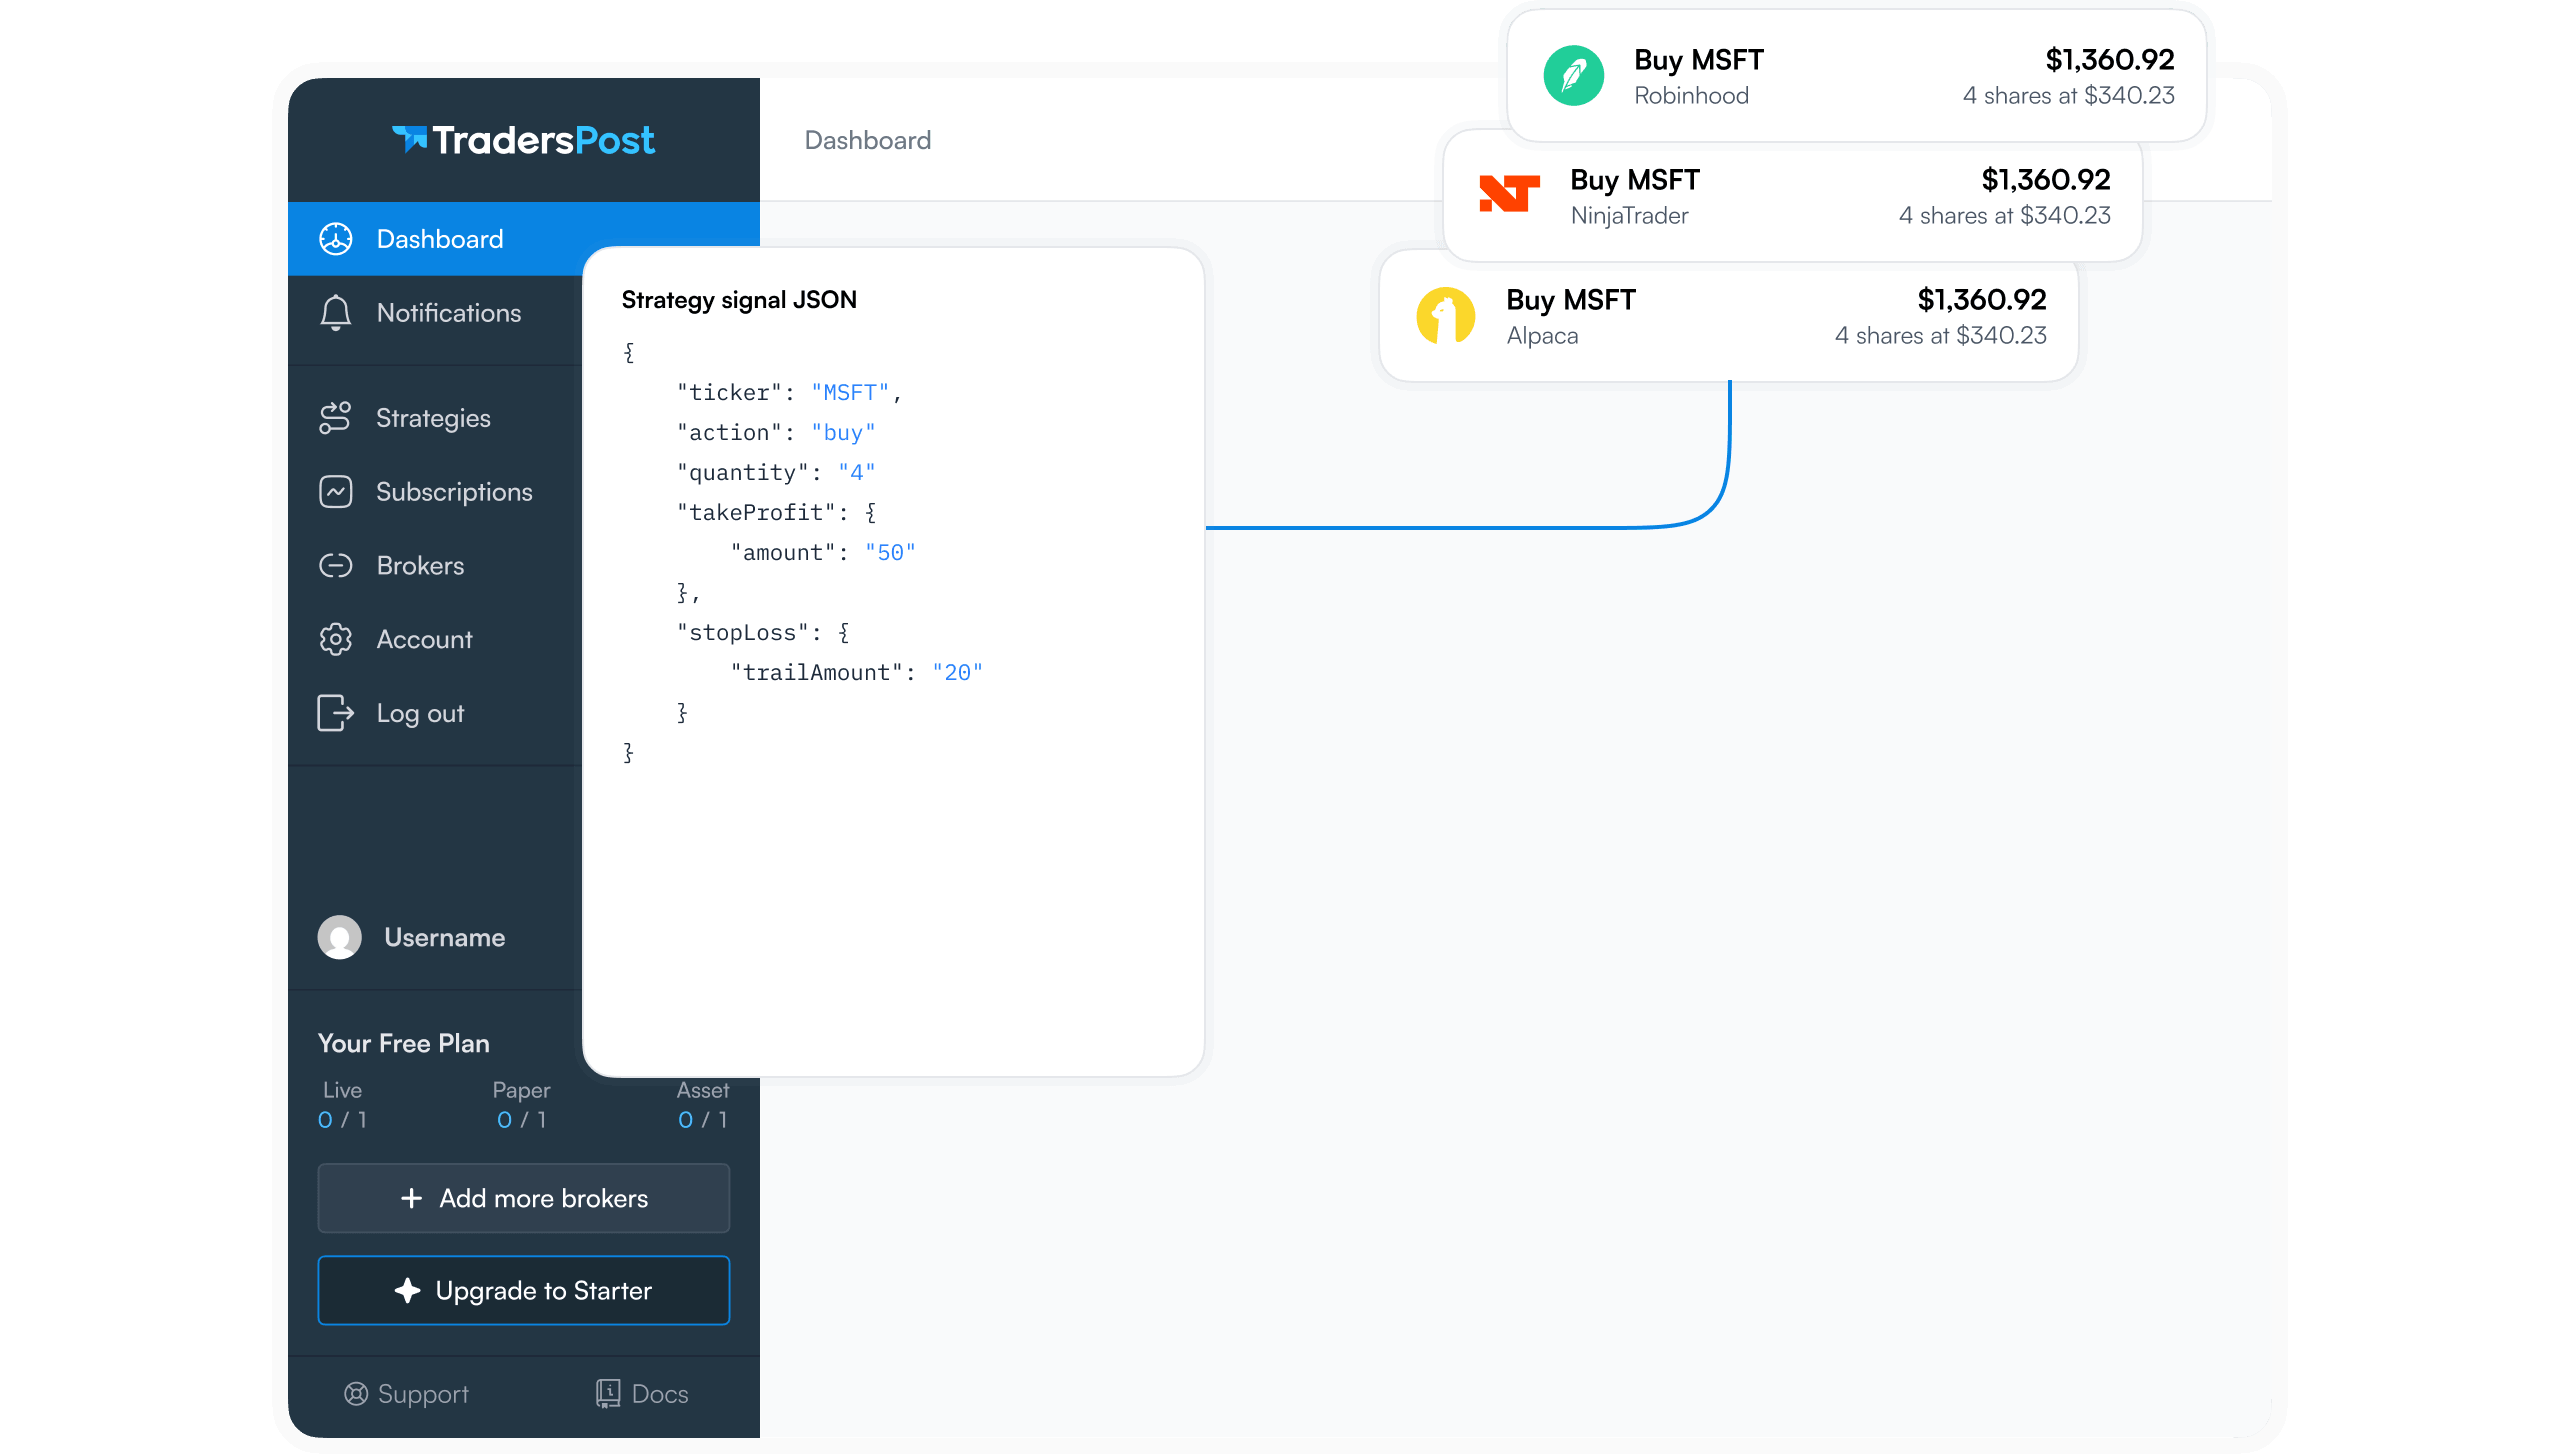
- Audit every automated instruction. Before enabling automation, verify the ticker, action, quantity, takeProfit, stopLoss, and expiration values when applicable.6 A correct signal can still create an incorrect order if these instructions do not match the strategy specification.
- Use unfavorable evidence constructively. If forward results show larger slippage, delayed alerts, or different fills, revise the model assumptions and rerun validation. Do not exclude poor live outcomes merely because they reduce the historical performance report.
Frequently Asked Questions
Why does my Pine Script strategy perform differently in real time?
Real-time bars update continuously, while historical bars are finalized only after they close. This means signals can appear, disappear, or change during an active bar, especially when your strategy uses intrabar calculations or unconfirmed conditions. Higher-timeframe data, order-fill assumptions, slippage, commissions, and alert timing can also create differences between backtest results and live behavior. Test with realistic costs and verify how the strategy behaves on live bars before relying on historical performance.
What is lookahead bias in Pine Script backtesting?
Lookahead bias happens when a strategy effectively uses information that would not have been available when a historical trade occurred. It is especially common in multi-timeframe scripts when unfinished higher-timeframe values are treated as if they were already confirmed. This can make historical entries look more accurate than they would be in real time. Use confirmed higher-timeframe data, avoid future-looking settings, and validate your setup during live or paper trading conditions.
Does Bar Magnifier make Pine Script backtests accurate?
Bar Magnifier can improve intrabar order-fill simulation by using lower-timeframe data when it is available. This may provide more realistic assumptions for stop, limit, and other orders that could be triggered within a larger chart bar. However, it cannot remove every difference between a simulated fill and live execution. Liquidity, spreads, slippage, latency, and broker behavior still matter. Compare results with and without Bar Magnifier and include realistic commissions and slippage.
Should I use calculate-on-every-tick behavior for my strategy?
Use calculate-on-every-tick behavior only when your strategy is intentionally designed to react during an active bar. It can help model intrabar decisions, but real-time behavior may still differ from historical results because historical bars do not always preserve the same tick-by-tick sequence. Signals may also change before the bar closes. If repeatability and easier validation are your priorities, strategies based on confirmed bar-close signals are generally more reliable.
How long should I paper trade a Pine Script strategy?
Paper trade long enough to observe a meaningful number of trades across multiple market conditions, such as trends, ranges, high volatility, and quiet periods. Set a predefined testing period and trade-count target based on the strategy’s frequency; a low-frequency system may need several months or longer. Do not judge paper trading only by profit. Compare alert timing, simulated fills, trading costs, drawdown, position sizing, and execution consistency against the backtest.
Conclusion
Pine Script backtests are valuable for developing and filtering ideas, but they are not proof that a strategy will perform the same way in live markets. Bar-based assumptions, intrabar price movement, fill logic, slippage, commissions, repainting risks, and limited historical context can all produce results that appear more precise than they are.
Before risking capital, validate your rules through out-of-sample testing, forward testing, and paper trading. Compare expected entries and exits with actual market behavior, then refine position sizing and risk controls based on realistic execution.
Ready to test a consistent alert-to-execution workflow? Use TradersPost with TradingView alerts that include ticker, action, quantity, takeProfit, stopLoss, and expiration instructions where applicable.
Finally, use a disciplined checklist: confirm non-repainting logic, realistic costs, robust parameters, and repeatable alert formatting. Take the next step with measured validation and confidence.
References
1 TradersPost Docs, Paper Trading
2 TradingView, Pine Script Repainting
3 TradingView, Strategy Properties
4 TradersPost Docs, Position Sizing
5 TradersPost Docs, Webhooks
6 TradersPost Docs, TradingView Signal Source
7 tradingview.com, Essential / Strategies