Retail Investor Sentiment 2026: What Surveys Say
Retail investor sentiment in 2026 has turned bearish. See what Schwab and AAII surveys signal and build rules-based, automated trading plans with discipline.

Marketing

Bottom Line
- In Q2 2026, 58% of Schwab retail clients identified as bearish, up from 41% in Q1, while bullish sentiment dropped to 28% from 41%.
- Geopolitical conflict was the top concern for 70% of Schwab survey respondents, influencing market risk perceptions and sector-specific effects.
- Oil prices and inflation were concerns for 53% and 38% of respondents, respectively, affecting market expectations and sector sensitivities.
- Recession expectations among active traders rose to 39% in 2026, up from 24%, indicating a shift in economic outlook.
- The AAII Investor Sentiment Survey is used as a contrarian indicator, with high bearishness suggesting limited further selling pressure.
Retail investor sentiment 2026 has shifted sharply from optimism to caution, with the latest Schwab and AAII survey data showing a market audience increasingly worried about valuations, volatility, and the durability of the rally. That does not automatically mean stocks are headed lower, but it does mean individual investors are approaching risk very differently than they were just months ago.
In this post, we will break down what the major retail sentiment surveys are measuring, where bullish, bearish, and neutral readings stand, and why sentiment can matter even when it is not a standalone buy or sell signal. You will also learn how to distinguish a contrarian opportunity from a legitimate risk warning, using survey trends alongside price action, volatility, and position sizing.
Most importantly, we will turn the data into an actionable framework. Rather than reacting emotionally to gloomy headlines or euphoric survey readings, investors can use rules-based, automated trading plans to define entries, exits, hedges, and risk limits before the market forces a decision.
Retail Investor Sentiment in 2026: The Midyear Picture
Why Retail Sentiment Matters to Active Traders
Retail investor sentiment is the collective market outlook expressed by individual investors through survey responses, account positioning, trading activity, options demand, cash allocations, and willingness to assume risk. For active traders, it is a market-context input, not a standalone buy or sell signal.
Sentiment data can identify whether retail participants are becoming fearful, optimistic, defensive, or concerned about economic conditions. That information is useful when it aligns with other observable market conditions. For example, a surge in bearish survey responses alongside rising implied volatility, weak market breadth, and repeated failures at resistance suggests a different environment than bearish survey responses occurring while the S&P 500 holds above a rising 50-day moving average.
Automated strategies should treat sentiment as a conditional filter rather than an execution trigger. A rules-based system might reduce long exposure when bearish sentiment coincides with deteriorating breadth and a confirmed break below support. It should not short equities simply because a survey reports widespread pessimism. Price action, volatility, liquidity, and a tested trading plan must determine execution.
The mid-2026 picture presents an important contrast: retail clients have become notably more bearish, while contrarian traders may view unusually negative sentiment as a condition worth monitoring for exhaustion, stabilization, or a potential relief rally.
Schwab's Q2 2026 Survey Shows a Sharp Move Toward Bearishness
Charles Schwab's Q2 2026 Retail Client Sentiment Report showed a substantial deterioration in retail views on U.S. stocks. Fifty-eight percent of Schwab retail clients described themselves as bearish in Q2 2026, up from 41% in Q1 2026. Meanwhile, only 28% were bullish in Q2, down from 41% in Q1.1
This is a meaningful shift in survey-based positioning psychology. The move reflects a larger share of clients expecting weaker equity-market conditions and a smaller share expecting gains. It does not, however, forecast future S&P 500 returns. Survey participants can remain bearish while prices continue to decline, trade sideways in a volatile range, or recover sharply if selling pressure becomes exhausted.
The primary source is Schwab's Q2 2026 Retail Client Sentiment Report. Traders should also recognize that the survey measures Schwab client sentiment, not every retail investor, institutional positioning, or aggregate market exposure.
The Key Takeaway: Bearish Sentiment Is a Condition, Not a Command
A high bearish reading can precede further declines, a choppy consolidation, or a relief rally. The critical distinction is between a sentiment extreme and a confirmed market reversal. Extreme pessimism may indicate that many investors have already reduced risk, but it does not establish that sellers are finished.
- Trend: Is the index above or below its key moving averages, and are those averages rising or falling?
- Volatility: Is implied volatility expanding with downside momentum, or contracting as price stabilizes?
- Breadth: Are advancing stocks, new highs, and sector participation improving?
- Support and resistance: Has price reclaimed a defined level, or merely bounced within a downtrend?
- Risk rules: Are entry, stop, position size, and exit conditions predefined and testable?
For automation, require confirmation. A contrarian long setup might require bearish sentiment, a breadth improvement, and a close above resistance before entry. That framework converts sentiment from a headline into a measurable trading condition.
What Is Driving Retail Investor Concern?
Geopolitical Conflict Is the Largest Reported Concern
Geopolitical conflict was the most frequently cited concern in the Schwab survey, identified by 70% of respondents. For traders, the relevant issue is not simply whether a conflict escalates, but how it changes expected cash flows, commodity availability, government spending, and risk appetite across markets.
Geopolitical uncertainty can trigger broad risk-off flows into perceived defensive assets, while simultaneously creating sector-specific effects. A disruption near a major shipping route, for example, may raise freight and input-cost expectations for retailers and industrial firms. Increased defense spending expectations may support selected aerospace and defense names. However, these reactions are often inconsistent and can reverse once initial headlines are absorbed.
Automated strategies should not convert geopolitical headlines directly into directional equity trades. Headline-driven moves frequently occur overnight, gap through stops, and reverse during regular trading. A more disciplined approach is to use event flags to adjust exposure controls, such as reducing position size, widening entry filters, limiting new overnight positions, or requiring confirmation from index futures, realized volatility, and sector breadth before acting.
Oil Prices and Inflation Remain Market-Moving Risks
Oil prices were cited as a concern by 53% of respondents, while 38% cited inflation. These concerns are connected, but they are not interchangeable. Sustained increases in crude oil can raise fuel, transportation, and production costs, which may feed into inflation expectations. That pressure can be especially relevant for consumer discretionary, transportation, airline, and other margin-sensitive sectors.
Higher inflation expectations can also affect assumptions about future interest rates and discount rates, influencing equity valuations. Still, traders should avoid treating rising oil or inflation data as an automatic bearish stock-market signal. Correlations change with growth conditions, earnings trends, central-bank policy, and the reason oil is rising. Oil driven higher by stronger global demand can carry different implications than oil rising because of a supply disruption.
- Broad market ETFs for index-level risk and sector rotation confirmation.
- Energy-sector ETFs to measure relative strength or hedge energy-price exposure.
- Treasury-related instruments to monitor changes in rate and inflation expectations.
- Volatility products or index options to evaluate implied-risk pricing and hedge costs.
For automation, use oil futures or energy ETF changes as inputs alongside volatility, Treasury yields, and market breadth, rather than as standalone trade triggers.
Recession Expectations Rose Among Active Traders
In the Schwab survey, 39% of active traders expected a recession in 2026, up from 24%. That is a meaningful change in sentiment, but a recession expectation is not an official recession determination, nor does it establish that equities must decline. Official recession dating is retrospective, while markets often reprice anticipated economic weakness well before confirming economic data arrives.
For systematic traders, the practical focus is managing changing expectations rather than forecasting a recession with certainty. Monitor whether defensive-sector leadership, credit spreads, index breadth, implied volatility, and rate-sensitive assets are confirming a deterioration in risk appetite. If signals align, a strategy might reduce gross long exposure, shorten holding periods, tighten portfolio-level loss limits, or add defined-risk hedges. If confirmation fails, rules should prevent sentiment alone from forcing a bearish allocation.
Schwab vs. AAII: How to Read Sentiment Surveys Differently
What the Schwab Survey Measures
Schwab’s retail investor research should be read as a view into the attitudes, concerns, and stated intentions of its client base, not as a universal measure of every U.S. household investor. Its value is often contextual: it can show whether retail participants are focused on inflation, interest rates, recession risk, election-related uncertainty, earnings, or a specific market drawdown. That emotional and macroeconomic backdrop can help explain why traders are reducing risk, holding more cash, favoring income strategies, or concentrating in large-cap equities.
Do not treat a Schwab survey result as directly interchangeable with another provider’s sentiment series. Comparability depends on the respondent base, account characteristics, survey date, sample size, weighting method, question wording, and whether the survey asks about market direction, portfolio actions, financial confidence, or economic expectations. A survey of active brokerage clients can produce a materially different signal from a broad survey of self-identified individual investors.
For an automated research process, store the publication date, fieldwork period, headline responses, and source link. Tag each release with its primary concern, such as inflation, recession, rates, or equity valuations. This prevents a model from interpreting a general economic-confidence question as a direct directional S&P 500 signal.
Why Traders Often Use AAII Sentiment as a Contrarian Indicator
The AAII Investor Sentiment Survey is widely monitored because it publishes individual investors’ expectations that the stock market will be higher, lower, or roughly unchanged over the next six months.2 The reported bullish, bearish, and neutral percentages are most useful when compared with their long-run averages and recent ranges, rather than viewed as isolated weekly numbers.
The contrarian case is straightforward: unusually high bearishness can indicate broad pessimism. If many investors have already reduced equity exposure or hedged perceived downside risk, incremental selling pressure may be limited. A subsequent improvement in price, breadth, or volatility can then support a rebound. For example, elevated AAII bearishness alongside a stabilizing S&P 500, falling VIX, and improving advance-decline data is more constructive than bearishness alone.
However, extreme bearishness is not confirmation that a market bottom is in. Bearish readings can remain elevated through persistent downtrends, recessions, liquidity stress, or earnings deteriorations. A systematic trader should check the current AAII release, its historical percentile, and its multi-week change. A single high-bearishness print should be a research condition, not an automatic long entry.
- Flag bearish sentiment above a predefined historical percentile.
- Require trend confirmation, such as the S&P 500 reclaiming a moving average or a positive 20-day return.
- Require breadth confirmation, such as improving percentage of stocks above their 50-day moving averages.
Use Survey Divergence as a Research Prompt, Not an Override
Divergence between surveys can be informative. Schwab respondents may report acute concern about the economy while AAII bearishness is near average, or both surveys may be pessimistic while market breadth continues to strengthen. These differences may reflect distinct respondent populations, survey timing, or the gap between stated concern and actual positioning.
Create a simple sentiment dashboard with the survey release date, fieldwork date, bullish and bearish readings where available, S&P 500 trend state, VIX level and change, advance-decline measures, and the percentage of index constituents above key moving averages. Review whether extreme sentiment has historically improved the performance of your existing setup, such as a mean-reversion entry or trend-following filter.
Do not rewrite strategy rules after every survey release. Instead, predefine whether sentiment is an entry filter, position-sizing input, regime label, or post-trade research variable. The objective is to test whether survey information adds incremental value beyond price, volatility, and breadth, not to let each headline override a validated trading process.
How to Turn Bearish Sentiment Into Tradeable Rules
Strategy Example: Wait for a Confirmed Contrarian Rebound
Extreme bearish sentiment can be used as a setup filter for a potential rebound, but it is not an entry signal by itself. A systematic trader should require price confirmation before initiating a long position. This avoids buying simply because a survey, options positioning measure, or sentiment composite appears unusually pessimistic.
A hypothetical long rule set for a broad index ETF could require all of the following:
- A bearish sentiment composite is in its lowest 10% of readings over the prior 52 weeks.
- The ETF closes above its 10-day exponential moving average.
- On the next session, price breaks and closes above the prior day’s high.
- Confirmation is present through volume above its 20-day average or positive market breadth, such as advancing issues exceeding declining issues by at least 1.5 to 1.
The sentiment reading identifies conditions where a reversal may have asymmetric potential. The price breakout is the entry trigger. For example, an automated order could enter at the next session’s open after a qualifying close, with a protective stop placed below the most recent swing low or 1.5 times the 14-day ATR below entry. If price closes back below that swing low, the long thesis is invalidated and the position is exited.
Strategy Example: Trade With the Trend When Fear Is Confirmed by Price
Bearish sentiment is not always contrarian. When fear coincides with persistent technical weakness, traders may instead apply defensive or bearish trend-following rules. This approach assumes that negative sentiment reflects a market condition that is still being confirmed by selling pressure.
- The broad index closes below its 200-day moving average for at least five consecutive sessions.
- The VIX, or another relevant volatility measure, is above its 50-day average and above a predefined threshold, such as 25.
- Price fails at a defined resistance level, such as the 20-day moving average, or closes below a 20-day support low.
- The system enters only in the direction permitted by the account, broker, instrument universe, and strategy mandate.
Depending on those constraints, the response may be holding cash, reducing long exposure, buying protective puts, using defined-risk put spreads, or trading an approved inverse instrument. Risk controls should be explicit: cap capital allocated to the strategy, use a stop-loss based on structure or ATR, impose a maximum daily loss, and prohibit averaging down. A bearish signal does not justify adding to a losing position.
Strategy Example: Reduce Exposure Instead of Predicting the Next Move
Traders do not need to forecast a reversal or a breakdown when bearish sentiment and volatility rise. A third systematic response is to retain existing entry logic while reducing position size. This is particularly useful for automated strategies that perform adequately across regimes but experience larger variance during high-volatility drawdowns.
For example, a system that normally risks 1.0% of equity per trade could reduce risk to 0.35% when the index is below its 200-day moving average and 20-day realized volatility exceeds its 80th percentile. It could also suspend new positions after a strategy-level drawdown of 6%, resuming normal sizing only after realized volatility falls below the threshold and the strategy recovers above a specified equity-curve level.
Reducing exposure is a risk-management decision, not a market forecast. Document the exact conditions for cutting size, pausing entries, and restoring normal risk so the process remains testable and cannot be overridden by discretionary sentiment reactions.
Build a Sentiment-Aware Trading System Without Overfitting
Separate the Sentiment Filter From the Entry Signal
Use retail sentiment as an environment classifier, not as a standalone buy or sell command. A robust automated framework has two layers:
- Layer 1, sentiment regime: classify conditions as pessimistic, neutral, or optimistic using a predefined survey measure, percentile rank, and possibly its change over time.
- Layer 2, price execution: apply independently defined entry, exit, stop, and position-sizing rules.
For example, an equity-index system might classify the environment as pessimistic when a weekly retail-bearish reading is in its top 20% of observations over the prior three years. That classification does not automatically buy the S&P 500 ETF. Instead, it permits contrarian long setups only after price confirms: perhaps a close above the 20-day high, an RSI recovery above 50, or a breakout above a defined volatility-adjusted resistance level. In neutral conditions, the system can retain its normal trend-following rules. In highly optimistic conditions, it might reduce exposure to aggressive mean-reversion longs rather than initiate an automatic short position.
Using a survey number directly as an entry trigger, such as “buy whenever bearish sentiment exceeds 50%,” is vulnerable to overfitting. Survey extremes can persist for weeks while prices continue falling, and a threshold selected after examining historical outcomes may have weak out-of-sample support. Sentiment identifies potential asymmetry, while price action determines whether the market has begun to validate the trade.
Define Testable Rules Before Reviewing Results
Write the complete specification before running a backtest or inspecting performance reports. At minimum, define:
- Instrument universe: for example, SPY, QQQ, IWM, sector ETFs, or a liquid basket of large-cap stocks.
- Timeframe: weekly sentiment updates paired with daily bars, or another explicitly justified combination.
- Entry trigger and exit trigger: exact indicators, thresholds, order types, and timing assumptions.
- Stop-loss method: fixed percentage, ATR multiple, trailing stop, time stop, or structural invalidation level.
- Profit-taking method: target multiple, trailing exit, signal reversal, or partial exits.
- Sizing method: fixed dollar risk, volatility targeting, or capped fractional equity allocation.
- Maximum concurrent positions: including sector and correlated-exposure limits.
Test the rules across selloffs, sharp recoveries, low-volatility ranges, persistent bull trends, and high-rate or recession-risk periods. Most retail sentiment surveys are published weekly, so forcing them into an intraday strategy requires a clear hypothesis. A weekly reading may reasonably gate daily swing entries, but it is unlikely to justify minute-by-minute signal changes unless the system can demonstrate a stable causal mechanism and realistic timestamp handling.
Track Whether the Sentiment Filter Adds Value
Run the same strategy twice: first as a baseline using only price-based rules, then with the sentiment filter enabled. Compare win rate, average win and loss, maximum drawdown, profit factor, market exposure, number of trades, and consistency across distinct test periods. Also review return volatility, worst consecutive losses, and performance after estimated spreads, commissions, and slippage.
A filter that reduces trades from 120 to 45 is not automatically an improvement. It should improve risk-adjusted outcomes, reduce drawdown to a level consistent with the trader’s mandate, or materially improve the quality of capital deployment. If the filtered system merely removes trades while lowering total return and leaving drawdown unchanged, sentiment is adding complexity without operational value. Validate the result with walk-forward testing and an untouched out-of-sample period before deploying capital.
Automate Sentiment-Informed Execution With TradersPost
Create Alerts in TradingView or TrendSpider
Retail sentiment surveys are most useful when they define a market regime, not when they become discretionary buy or sell headlines. If survey readings indicate unusually bearish retail positioning, a trader may classify the environment as contrarian-bullish, then require price confirmation before any automated entry. The survey establishes context. The chart determines execution.
For example, an automated long setup for an index ETF could require all of the following conditions:
- The trader has designated the current sentiment regime as contrarian-bullish.
- SPY closes above its 50-day moving average.
- SPY closes above the highest close of the prior 20 trading sessions.
- The alert fires only once per completed bar, after the daily close.
This avoids buying merely because a sentiment survey shows pessimism. The automation acts only after price confirms that buyers have regained control.
A defensive setup can be equally explicit. For instance, trigger a risk-reduction or short-bias alert only when QQQ closes below a defined support level, such as the lowest close of the prior 20 sessions, and a volatility filter is active, such as VIX closing above 25 or above its 20-day moving average. Define every variable in the TradingView or TrendSpider alert before connecting it to TradersPost, including timeframe, session rules, symbol mapping, order direction, and duplicate-alert behavior.
Apply Position Sizing and Order Protection Systematically
Position size should be determined before an alert fires, not improvised after a sentiment-driven move begins. Use a documented sizing method, such as a fixed dollar risk per trade, a fixed percentage of account equity, a fixed share quantity, or volatility-adjusted sizing based on the distance to a stop level.3
For example, if the account risk limit is $500 per trade and the planned entry is $100 with a stop at $97.50, the per-share risk is $2.50. The maximum position is 200 shares before accounting for commissions, slippage, and any portfolio-level limits. A sentiment regime does not justify exceeding the predefined risk budget.
Where appropriate, automate protective exits through stop-loss and take-profit instructions. Stops can limit downside, but they do not guarantee the intended fill price. During market opens, news releases, or rapid sentiment reversals, stop orders may execute materially below the stop trigger for long positions, or above it for short positions.4
- Set a maximum number of new trades per day.
- Cap total open exposure across all strategies.
- Limit correlated positions, such as simultaneous long exposure to SPY, QQQ, and leveraged technology ETFs.
- Reduce permitted exposure when volatility filters indicate an unstable sentiment regime.
Paper Test Before Trading Live Capital
Paper testing should be mandatory for every new sentiment-aware automation.5 A strategy can appear logically sound while still producing unintended orders because of alert timing, symbol configuration, broker defaults, or duplicate webhook messages.
Test normal entries and exits, repeated alerts from the same chart condition, stop behavior, take-profit behavior, market-open alerts, and rapid price movement scenarios. Verify whether an alert based on a completed daily bar can accidentally generate an order during an intraday recalculation. Confirm that a reversal signal closes an existing position before opening a new one when that is the intended behavior.
Review a meaningful sample of paper trades across different market conditions, including calm sessions, high-volatility sessions, and gap opens. Before enabling live execution through TradersPost, confirm that broker account selection, order type, quantity logic, extended-hours settings, stop parameters, and position limits exactly match the documented strategy.
Risk Management When Retail Sentiment Is Bearish
Avoid Treating Pessimism as a Guaranteed Market Bottom
Bearish retail sentiment can be a useful contrarian input, but it is not a standalone buy signal. Survey readings can remain deeply pessimistic for weeks or months while prices continue to decline. A high percentage of bearish respondents may indicate that fear is elevated, but it does not identify the point at which forced selling, earnings revisions, or macroeconomic pressure have finished affecting prices.
In 2026, traders should evaluate sentiment alongside the conditions driving the decline. Bearish survey data deserves less contrarian weight when forward earnings estimates are still falling, credit spreads are widening, market liquidity is thinning, or geopolitical events are creating new uncertainty. For example, an equity index may remain below its 50-day and 200-day moving averages despite an unusually bearish survey reading if companies are guiding lower and rates are repricing higher.
- Require price confirmation before increasing long exposure, such as a reclaim of a defined moving average, a higher low, or a breakout above a prior swing high.
- Use predefined invalidation levels rather than assuming a lower price is automatically a better entry.
- For automated systems, make sentiment a filter or sizing input, not the sole entry condition.
- Test whether extreme bearish readings improve results only when combined with volatility, trend, breadth, or relative-strength conditions.
A systematic rule might permit a long entry only when bearish sentiment is above a historical threshold, the index closes above the prior five-day high, and realized volatility has stopped expanding. This approach avoids buying solely because a survey appears unusually negative.
Plan for Volatility, Gaps, and Execution Differences
Bearish sentiment often coincides with unstable price action. Overnight headlines, inflation releases, employment data, central-bank decisions, earnings warnings, and geopolitical developments can produce opening gaps that bypass anticipated entry or exit levels. A stop order can limit risk under normal conditions, but it does not guarantee a specific fill price in a rapidly moving market. A sell stop at 5% below entry may execute 7% or 10% below entry after a significant overnight gap.
Position sizing must account for this difference between model risk and executable risk. Avoid oversized positions based on narrow historical stop distances, particularly in leveraged ETFs, small-cap equities, options, and products with limited overnight liquidity. When uncertainty exceeds the strategy's tolerance, maintaining cash or reducing gross exposure is a valid risk-management decision.
- Model gap scenarios separately from intraday stop-loss scenarios.
- Set maximum portfolio heat, sector concentration, and correlated-position limits.
- Use limit orders carefully, recognizing that they control price but may not receive a fill during fast markets.
- For options strategies, account for wider bid-ask spreads, implied-volatility changes, and early-assignment risk where relevant.
Keep a Trading Journal That Separates Thesis From Evidence
Record the sentiment backdrop for every trade, but distinguish it from the evidence that triggered execution. A useful journal entry includes the survey reading and date, market trend, technical trigger, entry price, position size, planned exit, actual exit, realized slippage, and whether the strategy rules were followed. For automated traders, save the signal inputs, version of the strategy logic, order timestamps, and actual broker fills.
Review trades in batches. Did bearish survey context improve expectancy, reduce drawdowns, or improve timing? Or did it encourage narrative-driven trades that overrode trend and risk controls? A sentiment indicator is valuable only if it produces measurable improvement after costs, slippage, and adverse gaps.
Repeatable execution matters more than having a perfect market opinion. A disciplined process can survive an incorrect sentiment interpretation. An unstructured trade based on a persuasive bearish or bullish narrative usually cannot.
Frequently Asked Questions
What does retail investor sentiment mean in 2026?
Retail investor sentiment describes how individual investors feel about the stock market, economy, and investment risk. In Schwab's Q2 2026 survey, 58% of retail clients were bearish on U.S. stocks, while 28% were bullish. These readings can help investors understand the broader market mood and potential positioning extremes. However, sentiment should be used as context, not as a substitute for a tested entry, exit, position-sizing, and risk-management plan.
Is bearish retail sentiment a buy signal?
No. Bearish retail sentiment alone is not a buy signal. Some traders treat extreme pessimism as a possible contrarian condition because widespread fear can occur near market lows. However, bearish sentiment can remain elevated while prices continue to decline. Before taking a contrarian trade, look for price confirmation, trend analysis, volatility conditions, and predefined risk limits. Paper test any sentiment-based strategy before committing live capital.
How is the AAII sentiment survey used as a contrarian indicator?
The AAII sentiment survey tracks bullish, bearish, and neutral expectations among individual investors. Traders often watch for unusually high optimism or pessimism compared with historical ranges. Extreme bearishness may indicate widespread fear and create a potential contrarian setup, but it does not confirm that a market bottom has formed. Compare current readings with past extremes and wait for objective, price-based confirmation before acting.
What were retail investors most concerned about in Schwab's Q2 2026 survey?
Geopolitical conflict was the leading concern in Schwab's Q2 2026 survey, cited by 70% of respondents. Oil prices were the next-largest concern at 53%, followed by inflation at 38%. Recession fears also increased among active traders: 39% expected a recession in 2026, up from 24% previously. These concerns help explain the survey's bearish tilt, though they do not predict short-term market direction.
Can I automate a sentiment-aware trading strategy with TradersPost?
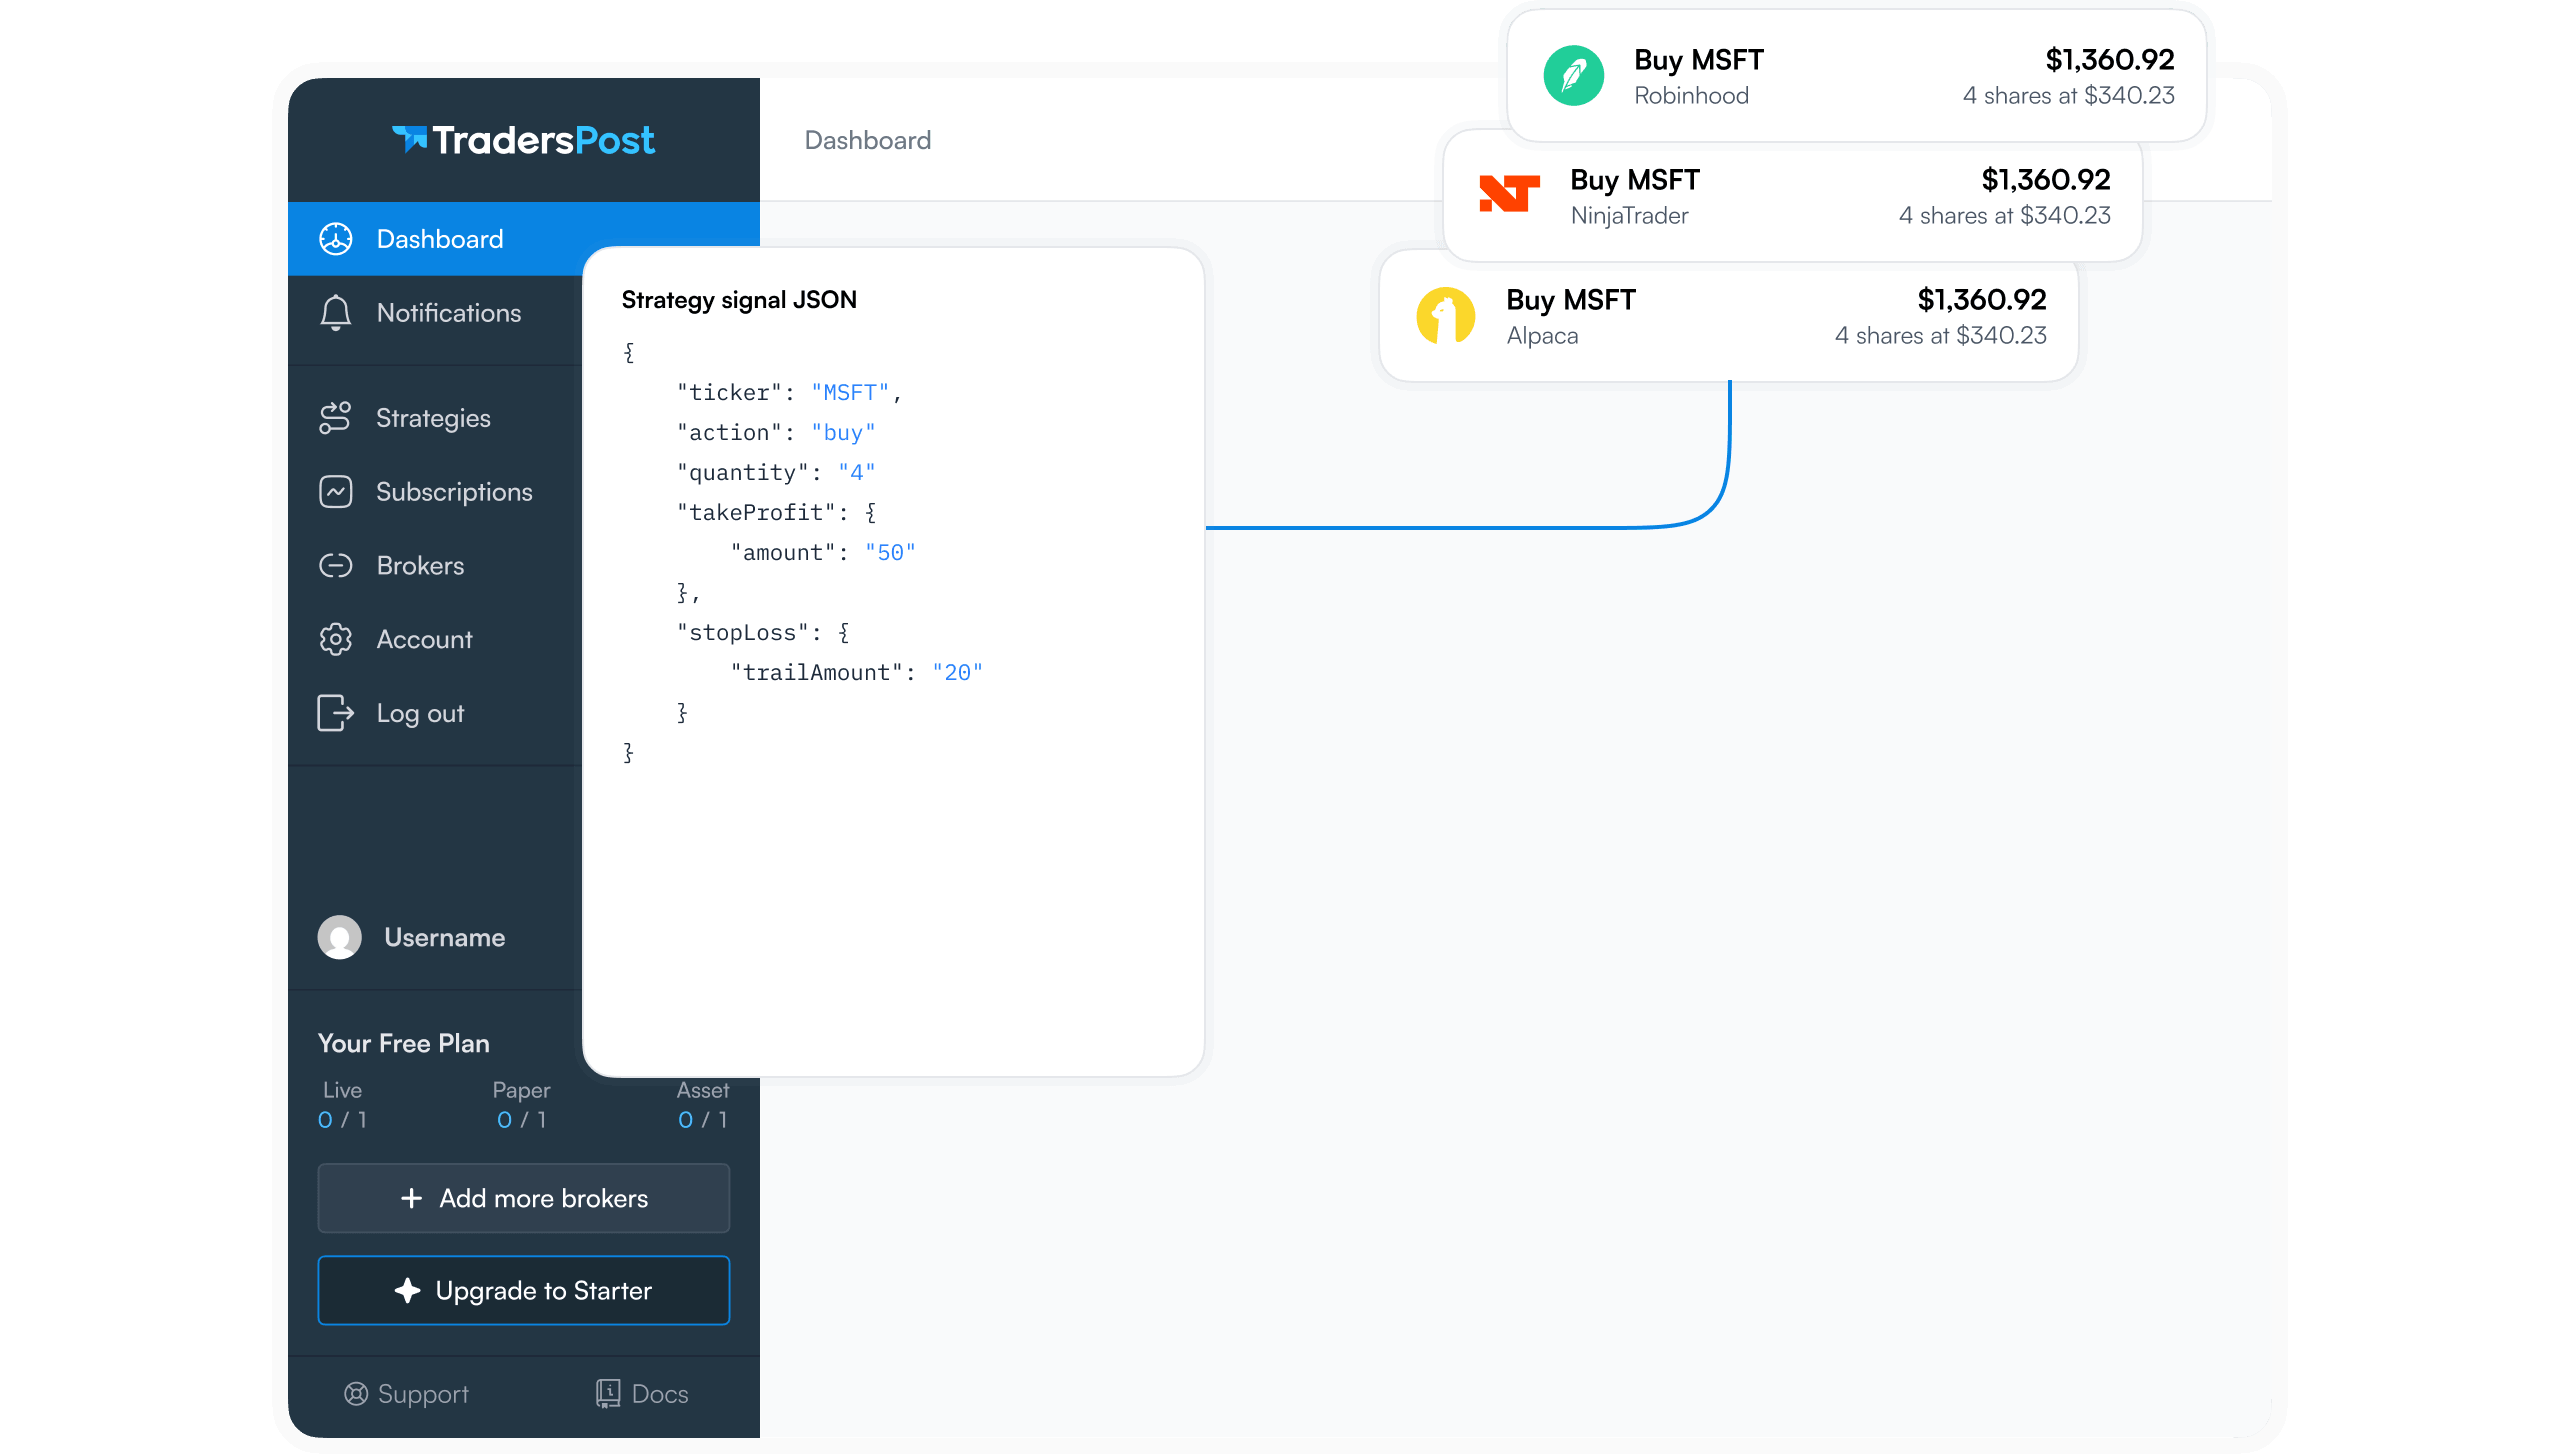
Yes. You can create objective entry and exit rules in TradingView or TrendSpider and send webhook alerts to TradersPost for rule-based execution through a connected broker.6 Rather than reacting manually to survey headlines, define position sizing, order settings, and risk controls in advance. Sentiment can be used as a filter or market-regime input alongside technical rules. Paper test alerts and execution behavior before enabling live trading.
Conclusion
Retail investor surveys in 2026 can help identify optimism, caution, and potential crowding, but they are most valuable when treated as context rather than a standalone trading signal. Extreme bullishness may warrant tighter risk controls, while unusually negative readings can highlight areas worth monitoring for reversal setups. The key is to combine sentiment with price action, volatility, trend confirmation, and a clearly defined risk plan.
Automate Sentiment-Informed Execution With TradersPost
Before committing live capital, paper test a rules-based TradingView or TrendSpider alert workflow in TradersPost. Define the sentiment conditions, technical confirmations, entries, exits, and position-sizing rules you want to use, then evaluate how the strategy performs across changing market conditions. Turn survey insights into disciplined, repeatable execution and take the next step with confidence.
References
1 Schwab Q2 2026 Retail Client Sentiment Report
2 AAII Investor Sentiment Survey
3 TradersPost Docs, Position Sizing
4 TradersPost Docs, Order Behavior
5 TradersPost Docs, Paper Trading
6 TradersPost Docs, Webhooks