Wendys WEN Meme Stock Rally: Trader Lessons
Analyze the June 2026 Wendys WEN meme stock rally, short-squeeze risks, and rules for sizing, exits, and automated execution with TradersPost for live trades.

Marketing

Bottom Line
- On June 24, 2026, Wendy's stock (WEN) rose as much as 42% intraday before closing up 25.6% at $7.87, with 202 million shares traded.
- The rally was linked to a WallStreetBets post and coincided with the appointment of Steve Cirulis as CFO and Chief Strategy Officer.
- Wendy's short float was reported near 23%, significantly lower than GameStop's 140% during its 2021 short squeeze.
- Retail net buying in Wendy's reached near record levels, contributing to the momentum feedback loop.
- Traders should use relative volume, resistance behavior, and first-pullback tests to assess the sustainability of such rallies.
The June 2026 Wendy’s WEN meme stock rally turned a familiar restaurant ticker into a high-volatility trading event, where social momentum, short interest, and rapid option activity could move the stock far faster than its fundamentals. For traders, the opportunity was not simply spotting a ticker that was trending. It was managing the gap between a potential short squeeze and the sharp reversal that often follows when momentum buyers rush for the exits.
This analysis breaks down the mechanics behind the Wendy’s WEN meme stock move, including why meme-driven rallies can accelerate, how short covering and options positioning may amplify price swings, and what signals matter once volatility expands. More importantly, you will learn practical rules for position sizing, stop placement, profit-taking, and avoiding oversized exposure in a trade that can change character within minutes.
We will also examine how TradersPost can support a more disciplined workflow by automating entries, exits, and risk controls for live trades. The goal is not to chase the next viral ticker, but to build an execution process that remains consistent when the crowd gets emotional.
What Happened in the June 2026 Wendy's Meme Rally?
The One-Day WEN Price Move in Context
On June 24, 2026, Wendy’s shares, ticker WEN, became a concentrated retail-momentum case study. The stock rose as much as 42% intraday before closing up 25.6% at $7.87. Approximately 202 million shares changed hands, an exceptional turnover level for the company and a clear sign that order flow, rather than a gradual reassessment of fundamentals alone, was driving price discovery.
Reported coverage identified the move as a meme-stock-style rally linked to retail participation and social-media attention. See Seeking Alpha’s market report and TheStreet’s coverage.
For automated traders, the important lesson is not that a 25% closing gain creates a buy signal. It is that abnormal volume can materially change intraday volatility, spreads, fill quality, and stop-loss behavior. A momentum model should distinguish between a liquid trend continuation and a late-session crowded chase. Useful filters include relative volume versus the 20-day average, intraday realized volatility, percentage distance from VWAP, halt risk, and the rate of change in volume during each five-minute interval.
How the “Save Wendy’s” Post Became a Market Catalyst
Media reports linked the rally to a WallStreetBets “save Wendy’s” post that spread quickly through retail-trader channels. The post supplied a simple, repeatable narrative: a recognizable consumer brand, a heavily discussed ticker, and a collective-action framing that encouraged attention. That narrative can increase quote traffic and trading volume, attract breakout and momentum participants, and force short-term responses from market makers managing inventory and short sellers managing risk.
Neither a Reddit post nor elevated mentions establishes intrinsic value. Social attention can create a self-reinforcing short-term feedback loop, but it can also reverse when incremental buyers disappear. An automation rule should therefore treat social signals as event flags, not standalone entries. For example:
- Require social-mention acceleration to be confirmed by relative volume and a sustained price hold above VWAP.
- Cap position size when intraday realized volatility exceeds a predefined threshold.
- Avoid market orders when spreads widen materially or when price is extended far above the opening range.
- Define exit logic before entry, including a time stop if volume decelerates after the initial impulse.
Why Company News Added Fuel to the Story
The retail narrative coincided with a company-specific headline: Wendy’s appointed Steve Cirulis as CFO and Chief Strategy Officer. Management changes can be legitimate valuation-relevant developments because they may affect capital allocation, operating strategy, investor communication, and execution risk. In a meme-driven session, however, even a valid corporate announcement can become amplified beyond its immediate fundamental significance.
This combination is common in high-attention stocks: a social catalyst overlaps with a verifiable corporate event, earnings release, analyst action, industry development, or macro headline. Traders should separate the inputs. Confirm the appointment through company filings or official releases, evaluate the stated role and timing, then assess whether the market’s price move is proportionate to the information. A robust event-driven system should label WEN’s June 24 move as a combined news-plus-social-flow event, rather than assuming that either catalyst independently justified the full rally.
Why WEN Became a Meme Stock Trade
Retail Buying and the Momentum Feedback Loop
WEN became a meme-stock trade because retail attention translated into concentrated order flow. During the 2021 surge, Vanda Research reported that retail net buying in Wendy’s was near record levels, a context also cited by TheStreet when WEN jumped roughly 25% as retail traders piled in. That matters because meme-stock rallies are often driven less by a new cash-flow forecast than by the speed at which attention becomes executable demand.
The feedback loop is mechanical: social-media discussion, unusual-options activity, and headline coverage attract buy orders; buy orders expand price and volume; the move then appears on momentum screeners, broker “top movers” lists, and additional social feeds; new traders enter after seeing the breakout. Automated strategies can detect the early stages through abnormal relative volume, accelerated trade counts, price distance from VWAP, and repeated breaks of intraday consolidation ranges.
High retail participation can create short-duration opportunity, particularly for traders equipped to monitor liquidity and enforce exits. It also raises the probability of emotional, crowded entries. A system that buys only because WEN is trending on social platforms is vulnerable to entering after the most aggressive demand has already been absorbed.
Volume, Liquidity, and Why a 202 Million-Share Day Matters
A reported 202 million-share trading day signals exceptional participation for WEN. It confirms that many market participants were actively repricing the stock, but it does not predict whether the next move will be higher or lower. Extreme volume can mark breakout continuation, distribution into late buying, short covering, or the beginning of a reversal.
Higher volume generally improves displayed liquidity during the rally, allowing tighter spreads and larger executable size. That benefit can disappear quickly if momentum reverses. When bids pull, marketable stop orders may receive poor fills, and a stock that traded smoothly on the way up can gap through intended exit levels.
- Relative volume: Compare current session volume with WEN’s 20-day average at the same time of day, not only with full-day historical volume.
- Resistance behavior: Flag volume spikes near prior highs, round-number levels, and premarket highs. A breakout that cannot hold above resistance after heavy turnover deserves caution.
- First-pullback test: In a healthy continuation pattern, pullback volume often contracts and demand returns near VWAP or the breakout level. Heavy volume on the pullback can indicate distribution.
The Difference Between Attention and a Durable Thesis
A momentum thesis for WEN depends on continued participation: buyers must keep arriving, volume must remain elevated, and price must hold key intraday levels. A fundamental investment thesis depends on business performance, restaurant sales, margins, franchise economics, capital allocation, and valuation. These are different trades and require different risk controls.
Define the intended holding period before entry: minutes for an opening-range momentum setup, one session for a day trade, several days for a swing trade, or no trade if the setup does not match the strategy. WEN can be highly tradable during an attention-driven surge while still being unsuitable for a long-term portfolio, a low-turnover system, or any trader unable to tolerate rapid reversals.
Short-Squeeze Mechanics: What WEN Did and Did Not Show
How a Short Squeeze Can Accelerate a Rally
Short selling involves borrowing shares, selling them into the market, and expecting to repurchase those shares later at a lower price. If the price declines, the short seller can buy back the shares, return them to the lender, and retain the difference. If the price rises, however, the short position loses value and may require additional margin.
A short squeeze occurs when rising prices pressure short sellers to buy shares to cover their positions. Those buy-to-cover orders add demand to an already active rally, which can push the price higher and create further pressure on remaining shorts. For example, a stock moving through a well-watched intraday resistance level on several times its normal volume may trigger both momentum buying and short covering.
A squeeze is a market dynamic, not a predictable trading setup. Traders should not assume that high short interest guarantees continued upside, nor should they abandon stop-loss, position-sizing, or invalidation rules because a stock is being described as a squeeze candidate. A systematic strategy should define the price level, volume condition, and maximum acceptable loss before entering.
WEN's Short Float Versus GameStop in 2021
During the WEN meme-stock discussion, Wendy's short float was reported near 23%. That is elevated enough to make short covering a plausible contributor to volatility, but it was materially below GameStop's roughly 140% short interest during the 2021 episode. The distinction is important: GameStop's reported short positioning reflected an exceptionally crowded and structurally unusual setup, while WEN did not display the same extreme short-interest profile.
High short interest can amplify a rally, particularly when liquidity is thin and attention-driven volume is rising. It does not, by itself, establish that a stock is in a sustained short squeeze. WEN's move illustrates why traders should avoid labeling every heavily discussed, rapidly rising stock as a guaranteed squeeze. Social-media attention, headline momentum, options flows, and ordinary speculative demand can all produce sharp price moves without a GameStop-style short-interest imbalance.
Reported comparison: Seeking Alpha, “Meme Magic: Wendy’s Soars After Reddit’s WallStreetBets Rallies Behind the Restaurant Name”.
Data Points to Review Before Calling a Move a Squeeze
- Short interest or short float: Measure the percentage of the float sold short and compare it with the stock’s own history and sector peers.
- Days to cover: Estimate how many average-volume trading days would be required for shorts to cover.
- Borrow availability and cost: Tight share availability or rising borrow fees can indicate pressure on short sellers.
- Relative volume and price acceleration: Identify whether volume is materially above normal and whether price is holding gains rather than immediately fading.
- Options activity: Review unusually large call volume, open-interest concentrations, and near-term expirations.
- Broader market conditions: Assess sector strength, index direction, volatility conditions, and whether similar speculative names are moving.
For automation, treat these metrics as filters and context inputs, not entry signals. Combine them with a defined chart condition, such as a breakout above a prior high on relative-volume confirmation, and a specific invalidation level, such as a close back below the breakout range. Record the data date for every short-interest field. Exchange-reported short-interest figures are delayed and may not represent real-time positioning during a rapidly developing WEN-style rally.
The Biggest Risk: Chasing a Vertical Meme-Stock Move
Why Late Entries Have Unfavorable Risk-Reward
A vertical move in WEN can create the appearance of an easy continuation trade precisely when the risk has become least attractive. After a stock has already advanced 25% to 42% in a short period, the distance to a technically valid stop often becomes large relative to the remaining realistic upside.
For example, assume a trader buys a late breakout at $7.80 after several strong candles. If the nearest sensible invalidation level is below a prior intraday consolidation at $7.20, the position carries $0.60 per share of risk. To justify that risk under a 2:1 reward-to-risk framework, the trader needs a plausible target near $9.00. If the stock is already extended from VWAP, prior resistance, and its short-term moving averages, that target may not be realistic without another major catalyst.
A trade entered because the chart is moving quickly or social media appears euphoric has no repeatable entry criterion. Automated traders should require a measurable trigger, such as a defined breakout level, relative-volume threshold, spread limit, and invalidation price before an order can be eligible for execution.
Common Failure Patterns During Social-Media Rallies
- Buying after multiple extended green candles: Late entries frequently occur after the highest-volume expansion has already happened, leaving buyers exposed to a liquidity-driven pullback.
- Averaging down without a predefined rule: Adding simply because WEN is lower converts a planned trade into an open-ended inventory problem. Any scale-in rule should specify price levels, maximum shares, and total account risk before entry.
- Ignoring liquidity changes: A stock can trade with tight spreads and deep order books during the initial surge, then develop wider spreads and thinner displayed liquidity as momentum fades.
- Holding through a reversal because of online conviction: Viral posts, screenshots, and bullish price targets are awareness signals, not evidence that a technical level will hold.
These conditions are especially difficult to manage manually. News-driven volatility can produce trading halts, overnight gaps through stop levels, and intraday reversals that occur faster than discretionary order entry. A stop order also does not guarantee a fill at its stop price in a fast market. Automated risk controls should include maximum position size, a no-new-entry rule after extreme range expansion, and safeguards for abnormal spreads or halted trading.
A Better Approach: Trade the Setup, Not the Headline
The following are examples of structured approaches, not recommendations. Each requires predefined rules and should be paper tested before capital is at risk.
- First-pullback continuation: Trigger on a pullback that holds above VWAP or a prior breakout level after the first impulse. Confirmation may be a higher low with renewed volume. Place the stop below the pullback low, define partial profit-taking near the prior high or a fixed R multiple, and stand aside if price loses VWAP on expanding volume.
- Breakout-and-retest: Trigger only after WEN closes above a defined resistance level and subsequently retests it. Confirmation is support holding with improving bid volume. Use a stop below the retest low, take profits into measured-move targets or prior supply zones, and avoid the trade if the retest occurs on weak liquidity or broad-market risk-off conditions.
- Failed-breakout reversal: Trigger when price breaks resistance, fails to hold it, and closes back below the level. Confirmation can include a lower high and loss of VWAP. Define a stop above the failed-breakout high, cover into nearby support, and stand aside if the stock reclaims resistance with sustained volume.
No setup is guaranteed. The objective is not to predict the next meme-stock spike, but to execute a defined process with known risk, testable conditions, and explicit reasons not to trade.
Build a Defined-Risk Plan Before Trading WEN
Set Position Size From Dollars at Risk
For a WEN momentum trade, set share quantity from the amount you can lose if the setup fails, not from the number of shares that feels meaningful. For a long position, use:
Position size = maximum dollar risk ÷ (entry price − stop price)
If your maximum permitted loss is $100, your planned entry is $10.00, and the structural stop is $9.50, the entry-to-stop distance is $0.50. The maximum theoretical size is 200 shares:
$100 ÷ $0.50 = 200 shares
That calculation assumes a fill exactly at the stop. In a volatile WEN meme-stock move, reduce the size to allow for slippage, commissions, bid-ask spread, and possible gaps through the stop. An automated strategy might cap the initial order at 160 or 180 shares rather than the theoretical 200.
- Define a fixed dollar-risk limit per trade, such as 0.25% to 1.00% of account equity.
- Calculate size after selecting the entry and structural invalidation level.1
- Round down to a whole-share quantity and reject trades below a minimum expected reward-to-risk threshold.
- Do not tighten a valid stop simply to buy more shares. If the required risk is too large, reduce size or skip the trade.
Choose an Invalidation Level Before Entering
An invalidation level is the price or market condition showing that the reason for entering WEN is no longer valid. It is not an arbitrary loss amount. For example, a trader buying a pullback into VWAP may invalidate the long thesis if WEN closes below VWAP and the prior pullback low. A breakout trader may exit if price falls back below the breakout level and cannot reclaim it within a defined number of bars.
Write the condition in a form an automated system can execute. For example: enter only if WEN breaks $10.20 on volume above the 20-bar average; exit if a five-minute candle closes below $9.78. This is more testable than “sell if momentum weakens.”
Stop orders remain useful risk-management tools, but they do not guarantee execution at the stop price. During sharp news-driven moves, halts, or thin liquidity periods, WEN can trade through a stop level. Backtests and live risk limits should include a slippage assumption rather than treating stop fills as exact.2
Plan Profit-Taking and Time-Based Exits
Define the exit logic before sending the entry order. A practical framework is to take partial profits at a predetermined reward multiple, then manage the remainder with a separate rule. If entry is $10.00 and the stop is $9.50, initial risk is $0.50 per share. A 2R target is $11.00. An automated plan could sell 50% at 2R and trail the remaining shares below the prior five-minute bar low or a short moving average.
- Take partial profits at 1.5R, 2R, or another tested reward multiple.
- Trail the remainder below a moving average, VWAP, prior-bar low, or volatility-based stop.
- Exit if WEN closes below a specified moving average or loses VWAP after an extended run.
- Use a time stop, such as closing the trade if the breakout has not advanced by at least 0.5R within 30 minutes.
Time stops are particularly important in momentum trades. If expected follow-through does not occur, capital can become trapped in a stagnant position while the original catalyst fades. Decide before entry whether overnight holding is permitted. If it is not, program a mandatory flattening time before the closing auction, regardless of unrealized profit or loss.
Turn a Meme-Stock Setup Into an Automated Trading Workflow
Example Workflow: Breakout With Confirmation
A repeatable WEN breakout workflow begins with rules written before the alert fires. For example, define a resistance level at $20.00 from prior swing highs. A long setup is valid only if WEN closes above $20.00 on the selected trading timeframe, such as a 15-minute or daily chart, and relative volume is at least 1.8 times its 20-period average. The closing requirement matters because an intraday spike above resistance can reverse before the bar is complete.
Add an extension filter so the system does not chase a viral move. If the breakout bar closes more than 3% above the $20.00 level, reject the entry rather than buying an already extended candle. In this example, a close above $20.60 would invalidate the entry condition.
- Risk per trade: Set a fixed dollar amount, such as $250.
- Invalidation stop: Place the stop below the breakout level or the breakout candle low, for example at $19.55.
- Position size: Divide dollar risk by per-share risk. If entry is $20.10 and the stop is $19.55, risk is $0.55 per share, so $250 / $0.55 = 454 shares, rounded down and subject to a separate position-size cap.
- First target: Take partial profits at 1.5R, approximately $20.93 in this example.
- Trailing exit: Trail the remaining shares below a short moving average, such as the 9-EMA, only after the first target is reached.
This is an educational ruleset, not a recommendation to trade WEN or any other meme stock.
Use TradingView or TrendSpider Alerts as the Decision Gate
Alerts should function as a decision gate, not as a prompt to improvise. In TradingView, an alert can require WEN to cross above $20.00, close above that level, and satisfy a relative-volume condition. A separate alert might require a 9-EMA to cross above a 21-EMA after price has pulled back to a predefined support zone. The trading script or webhook should submit an order only when every required condition is true.3
TrendSpider users can create a multi-factor alert or strategy condition combining a resistance break, volume above a stated threshold, and trend confirmation. For example: “15-minute close above anchored VWAP and prior resistance, with volume greater than 150% of the 20-bar average.”
Avoid alerts such as “WEN is moving” or “unusual activity detected.” Those notifications provide no entry, invalidation, or risk framework, and they invite subjective execution during a social-media-driven surge.
Add Guardrails That Prevent Overtrading
Automation needs hard limits, particularly when repeated viral commentary creates multiple signals in the same session. Set a maximum daily realized loss, such as 2% of account equity or a fixed dollar amount. After that threshold is reached, disable new WEN entries for the day. Limit trades per symbol, for example two completed entries per session, and enforce a maximum position size regardless of the calculated risk size.
- Block new entries during the final 15 minutes of regular trading unless the strategy was explicitly tested for that period.
- Prevent duplicate entries while an existing WEN position or pending order is active.
- Require a cooldown period after a stop-out, such as 30 minutes or three completed bars.
- Pause the automation if spreads widen materially, liquidity deteriorates, or news creates conditions outside the strategy’s tested assumptions.
These controls reduce the chance that repeated alerts, rapid reversals, and constant social-media attention turn a defined setup into uncontrolled exposure.
Paper Test the Strategy Before Going Live
What to Test Using Historical Meme-Stock Volatility
Do not optimize an automated WEN strategy solely around the June 2026 rally. A setup tuned to one exceptional move can fit the noise of that event, including its specific opening gap, social-media attention cycle, liquidity profile, and short-covering pressure, then fail when WEN returns to ordinary trading conditions.
Build a test set that includes WEN and several comparable high-attention equities across different regimes: broad risk-on markets, weak index sessions, earnings-driven gaps, low-float squeezes, and post-hype reversals. Test the same entry and exit rules without changing parameters for each symbol. For example, if the system buys a break above the first 15-minute range after relative volume exceeds a threshold, measure whether that rule works after both upside gaps and failed upside gaps.
- Win rate: the percentage of completed trades that close profitably.
- Average win and average loss: verify that expected payoff remains positive after costs.
- Maximum drawdown: measure the worst peak-to-trough equity decline, not just isolated trade losses.
- Average holding period: determine whether the strategy depends on intraday momentum or multi-session continuation.
- Gap exposure: quantify losses when a stop cannot execute near its intended price after an overnight or market-open gap.
- Slippage: model realistic spreads, rapid price movement, and reduced fill quality during volume spikes.
Review results by regime. A system that performs only during extraordinary rallies is a conditional momentum trade, not a durable all-weather strategy.
Validate the Full Execution Chain
Paper trading must test the complete operational sequence, not merely the chart signal. Confirm that the chart condition triggers at the expected time, alerts do not fire excessively, webhook payloads contain the correct fields, and WEN maps correctly to the broker’s symbol convention.4 Then verify order quantity, buying-power checks, broker acknowledgement, stop placement, profit-taking orders, and time-based or condition-based exits.
- Send duplicate alerts intentionally and confirm idempotency rules prevent duplicate orders.
- Test rejected orders caused by invalid quantities, insufficient buying power, halted trading, or stale prices.
- Simulate partial fills and determine whether protective stops adjust to filled quantity.
- Run tests around the opening auction, when meme-stock spreads and volatility can expand sharply.
- Test webhook delays, broker API timeouts, lost connectivity, and restart behavior.
Maintain a trade journal with the planned signal price, alert timestamp, submitted order, actual fill price, stop and exit actions, realized result, and any execution exception. The difference between the intended trade and the filled trade is often more important than the backtest entry price.
The Durable Lesson From Wendy's Meme Rally
WEN’s meme-stock rally illustrated how retail attention, abnormal volume, and short-covering dynamics can accelerate a price move. It also showed why a viral narrative is not a trading plan. The repeatable process is clear: verify the catalyst, assess short-interest and liquidity context, define the setup, size the position for a known loss, establish exits before entry, test the automation, and only then consider live execution.
Risk disclaimer: Trading involves substantial risk, including the potential loss of capital. Historical events and prior price behavior do not predict future performance. Use position sizes, automation controls, and risk limits appropriate for your financial circumstances and trading objectives.
Frequently Asked Questions
Why did Wendy's stock rise in June 2026?
Reports attributed Wendy’s June 24, 2026 rally to a WallStreetBets “save Wendy’s” post, intense retail-trader interest, and near-record retail net buying reported by Vanda Research. The appointment of Steve Cirulis as CFO and Chief Strategy Officer also contributed to the catalyst backdrop. WEN rose as much as 42% intraday before closing up 25.6% at $7.87 on roughly 202 million shares, according to cited reports.5
Was the WEN rally a short squeeze?
Short covering may have added fuel to WEN’s momentum, but a rapid rally alone does not confirm a classic short squeeze. Reported short interest near 23% of the float was elevated, yet far below GameStop’s roughly 140% short-interest level during the 2021 episode. Traders should review short interest, days to cover, trading volume, borrow availability and costs, and the stock’s price structure instead of relying on a social-media label.
Is it risky to buy a meme stock after a big rally?
Yes. Buying after a large meme-stock move can create unfavorable risk-reward because a sensible stop-loss may sit far below the entry price, while reversals can happen quickly. Before entering, define objective entry criteria, maximum dollar risk, a stop-loss level, profit-taking rules, and whether you are willing to hold the position overnight. Avoid making decisions based solely on fear of missing out or viral posts.
How can TradersPost help automate a meme-stock trading strategy?
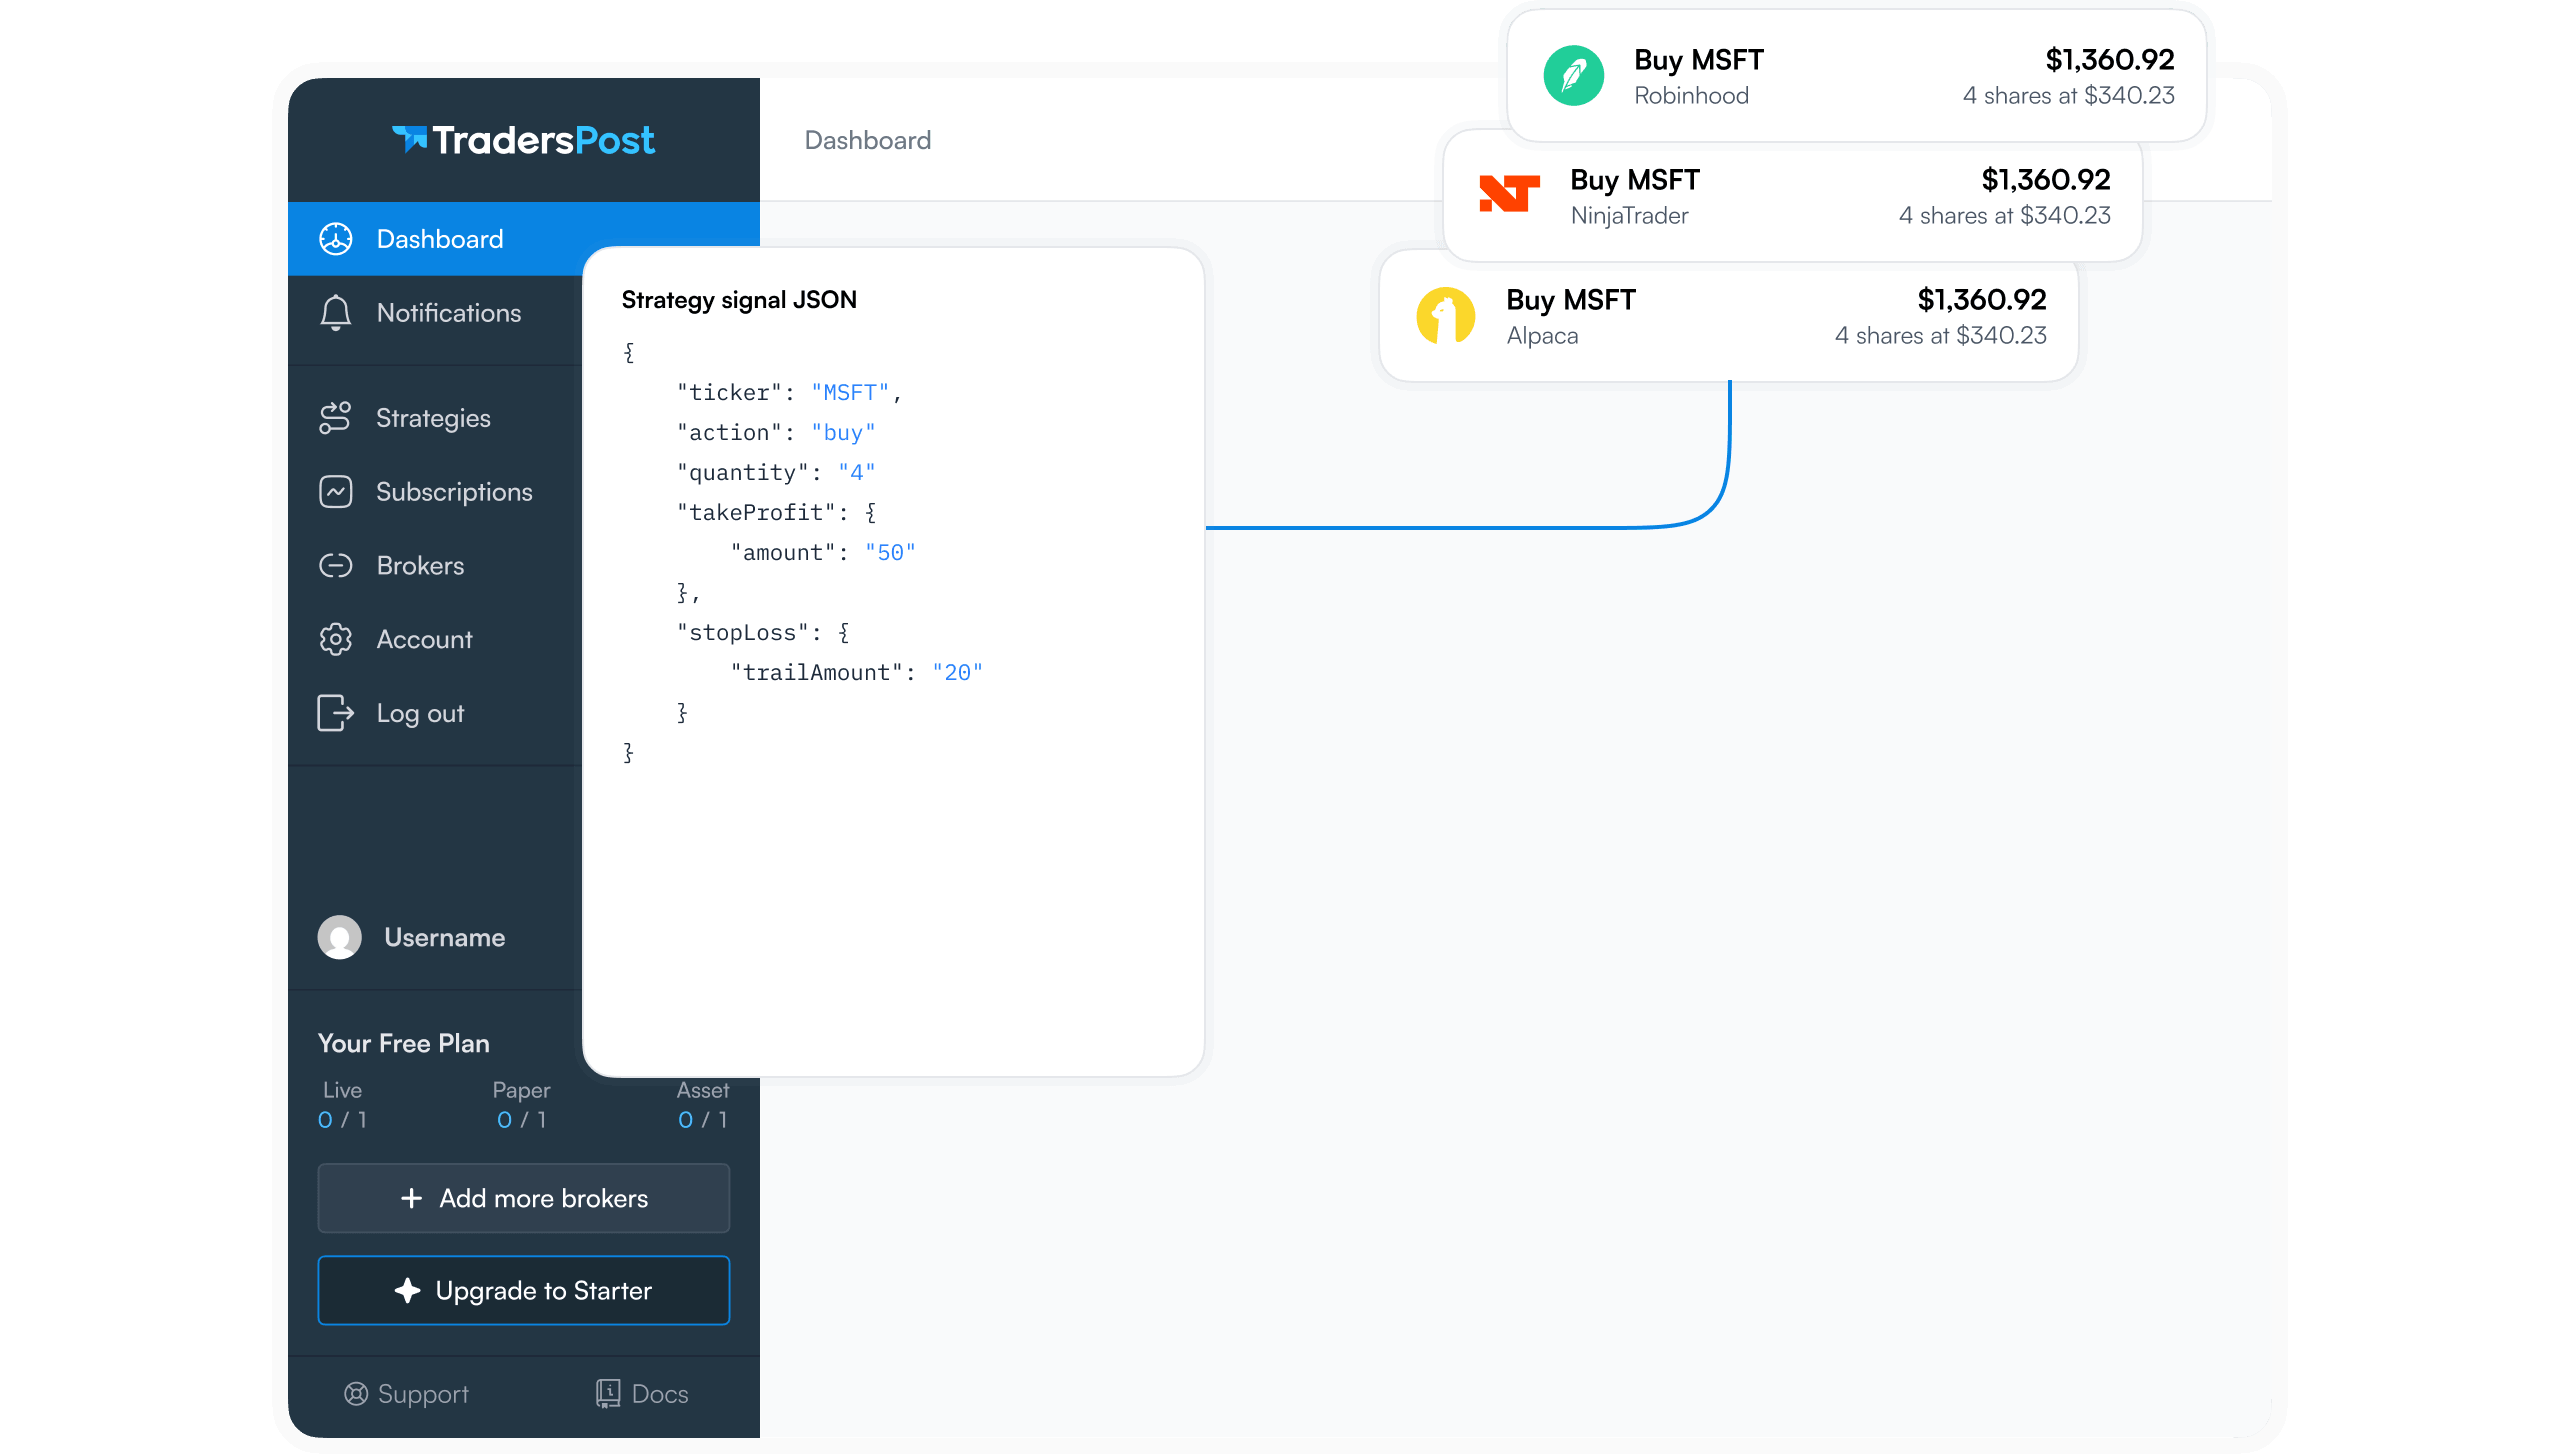
Traders can build objective conditions in TradingView or TrendSpider, then send webhook alerts to TradersPost. With a connected broker, TradersPost can apply predefined order execution, position-sizing, and risk-management rules when an alert is received. This can reduce emotional decision-making during volatile moves. Before trading live, paper test the full alert-to-order workflow to identify issues with strategy logic, sizing, timing, or order execution.6
Should traders paper trade a WEN-style momentum strategy first?
Yes. Paper trading can show whether entry triggers, exit rules, alert frequency, and position-sizing settings behave as intended without risking capital. Test the strategy on more than one event-driven stock and under different market conditions, including strong rallies, failed breakouts, and broad market weakness. This helps reduce the risk of overfitting a strategy to one unusual WEN-style move and provides a clearer view of potential execution challenges.
Conclusion
Wendy’s 2021 meme-stock surge showed how quickly social momentum, short interest, and options activity can overwhelm conventional valuation narratives. The lesson is not to chase every viral ticker, but to recognize when price action is being driven by attention and positioning rather than a durable change in fundamentals. Traders should define entry triggers, invalidation levels, profit targets, and maximum loss before placing an order.
A repeatable process matters most when volatility is highest: monitor alerts, confirm volume and trend conditions, use defined-risk structures, and paper test the rules across multiple setups. Create a TradersPost account, connect your TradingView or TrendSpider alerts, and paper test your defined-risk workflow before committing live capital. Build the discipline now so you can approach the next meme-stock move with a clear plan and professional confidence.
References
1 TradersPost Docs, Position Sizing
2 TradersPost Docs, Order Behavior
3 TradersPost Docs, TradingView Signal Source
4 TradersPost Docs, Webhooks
5 Seeking Alpha, Wendy's Soars After WallStreetBets Rally
6 TradersPost Docs, Paper Trading