Real-Time Algo Monitoring: What to Track
A breakdown of real-time algo monitoring: the four layers to track, alert thresholds that avoid fatigue, and how to diagnose failures fast.

Marketing

Real time algo monitoring is the continuous measurement of a live strategy's infrastructure, execution, positions, and performance. It identifies failures that trade-level controls may miss, including stale data, worsening slippage, partial-fill patterns, position drift, and sustained underperformance.
A practical monitoring stack needs clear baselines, persistent logs, severity-based delivery, and a runbook for every critical alert. The goal is not constant notification. It is fast detection of meaningful deviations, followed by enough evidence to diagnose the failure before it compounds.
What Real-Time Algo Monitoring Means
Monitoring vs Risk Controls
Risk controls block or halt transactions using limits such as maximum position size, allowed trading windows, or session loss caps. Monitoring looks beyond one transaction. It tracks cumulative changes in slippage, fill rate, position weights, latency, and P&L across days or weeks.
A strategy can pass every pre-trade check while its execution quality slowly deteriorates. Fill rates may decline, slippage may rise, and live returns may diverge from out-of-sample expectations without producing a technical error.1
The Four Monitoring Layers
- Infrastructure health: Is the process alive, is market data fresh, and are API requests succeeding?
- Execution quality: Are acknowledgments and fills arriving at expected times and prices?
- Position integrity: Do internal holdings match broker-confirmed records and intended target weights?
- Strategy performance: Is live P&L behaving consistently with the out-of-sample backtest distribution?
Why Silent Failures Are Dangerous
A deployed algo can fail without crashing. A stale feed can leave the process running while signals use outdated prices. An API can respond while returning stale order status. The most dangerous infrastructure failure is a dead or ineffective process that still appears healthy from a superficial connectivity check.2
Infrastructure Health Monitoring Basics
Heartbeats Confirm Process Health
Have the trading process write a timestamp to persistent storage every fixed interval. A separate watchdog should compare the current time with that timestamp. Alert when heartbeat age exceeds three times the expected interval, because the watchdog must remain independent of the process it monitors.3
Detecting Stale Market Data
A 1-minute feed should provide a new bar every 60 seconds during active market hours. A gap above 90 seconds indicates a possible disconnection or frozen feed. Add plausibility checks for price changes above 5%, volume above 10 times its recent average, and spreads above three times their normal level.4
Treat these thresholds as investigation triggers, not proof of bad data. Genuine news can create the same observations. Cross-check timestamps and a secondary data source before suppressing signals or restarting the feed.
Watching Broker API Health
Track API calls, errors, rejections, and response age by hour. A rising error rate can indicate expired authentication, rate limiting, connectivity problems, or a broker-side incident. Also verify that order-status timestamps advance. A responsive API returning stale state creates the same practical risk as a disconnection.5
Execution Quality Metrics to Track
Tracking Slippage With EWMA
Measure adverse slippage as fill price minus signal mid-price for buys, and signal mid-price minus fill price for sells. Convert the result to basis points so performance can be compared across symbols and price levels.
A 20-trade exponentially weighted moving average, or EWMA, smooths isolated noisy fills while responding to persistent changes. Investigate when it rises more than 50% above its baseline and remains elevated for at least 10 trades.6
Fill Rates by Order Type
Market orders in liquid large-cap stocks should fill near 100% of the requested quantity. Passive limit orders in less liquid instruments can have materially lower fill rates, with expected ranges around 60-80% depending on the strategy's price placement.7
Calculate fill rate as filled quantity divided by target quantity. Alert on a rolling sample falling below the strategy's tested range, not on one partial fill. Segment results by symbol, order type, session, and direction to identify where the deterioration originates.
Order Acknowledgment Latency
Acknowledgment latency measures the time from order submission to broker confirmation. A move from a normal level near 150 milliseconds to 1,500 milliseconds indicates connectivity deterioration.8 Sustained latency matters most for intraday systems, where a delayed order can encounter a meaningfully different market. Daily strategies should still log it as an API health indicator.
Position and Performance Monitoring
Reconciling Broker Positions
Compare the strategy's internal position model with broker-confirmed records at least once per trading session and after each order batch. Intraday systems should reconcile hourly. The report should show symbol, internal quantity, broker quantity, and the difference. Investigate every non-zero discrepancy, including one share or contract.9
Catching Position Weight Drift
Reconciliation can pass even when the portfolio has moved away from intended weights. Partial fills and quantity rounding can push a 5% target position into a range such as 3.8-6.4% over several weeks.10 A weekly actual-versus-target report exposes systematic under-allocation, over-allocation, or biased rounding.
Comparing Live and Backtest P&L
Convert each live daily return into a z-score using the mean and standard deviation from the out-of-sample backtest distribution. One unusual day is not evidence of decay. Five consecutive days below negative one standard deviation warrant investigation into signals, execution, costs, and market regime.11
Also compare a rolling 60-day live Sharpe ratio with the equivalent backtest baseline. A shortfall above 0.5 that persists for at least 30 days can signal deterioration, but 60-day estimates remain noisy. Six to twelve months of live data is needed before Sharpe comparisons become more reliable.12
Setting Alert Thresholds That Work
Avoiding Alert Fatigue
Alert fatigue trains operators to dismiss notifications. Calibrate the stack for no more than two or three genuine events per week during normal operation. If an alert repeatedly fires without revealing a real problem, revise its threshold, duration requirement, or grouping logic instead of learning to ignore it.13
Matching Channel to Severity
- SMS or paging: Process death, feed gaps, reconciliation differences, and sustained slippage spikes.
- Email: Fill-rate warnings, weight drift, and scheduled performance reports.
- Dashboard only: Healthy heartbeats, routine fills, and ordinary daily P&L variation.
A well-calibrated setup can produce roughly one or two SMS alerts per month during normal operation, keeping urgent channels credible.14
Writing Runbooks Early
Each alert needs a runbook that states what it means, what to inspect first, how to contain the risk, and the expected resolution time. Write and test runbooks before live deployment. Diagnosing an unfamiliar alert under time pressure encourages incomplete checks and premature restarts.
Alert Delivery Beyond Email
Physical Visual and Audio Alerts
A shared trading desk can supplement phone notifications with physical cues. Dry contact closure, SIP, or multicast triggers can activate a visual alerter. Devices may provide solid, non-flashing, low-intensity, or conspicuous flash patterns, allowing severity to map to a recognizable display.15
Hardware Heartbeats
Some IP alert devices can flash a heartbeat LED about every 30 seconds to confirm that the unit is powered and connected to the network.16 This mirrors a software heartbeat: both provide a positive indication of life rather than waiting for a failure event.
Multicast Trading-Floor Alerts
Multicast can send one page or alert stream to multiple receiving devices simultaneously. Receiving endpoints do not need separate SIP registration, which simplifies deployment across multiple desks.17 Physical alerting should supplement the monitoring database, not replace persistent logs and mobile escalation.
Monitoring vs Market Surveillance
What Exchanges Track
Regulatory and exchange surveillance examines participant behavior across the market. An order-to-trade ratio above 15 has been associated with high-frequency behavior. Cancellation metrics can count orders held for less than one millisecond, while quote-stuffing commonly appears as rapid placement and cancellation bursts lasting under 10 seconds.18
How Strategy Monitoring Differs
Personal strategy monitoring asks whether one system is operating as designed. Market surveillance looks for behaviors that could harm market integrity across participants. Operational monitoring is not a substitute for compliance surveillance, recordkeeping obligations, or professional compliance advice.
Profiling Your Order Messages
Message profiling measures the time between order messages and plots those intervals as a histogram. A distribution that shifts toward unusually short intervals can expose a runaway loop, duplicate event processing, or repeated cancellation logic. Surveillance research uses the same approach to characterize rapid order activity.19
Building a Complete Monitoring Workflow
Complete Setup Example
Consider a weekly momentum strategy holding 20 positions with $30,000 in capital. Its monitoring design could include the following:
- Write a heartbeat every 60 seconds and check it every five minutes. Send SMS if the latest heartbeat is more than three minutes old.
- Validate each data timestamp and alert on missing updates during the defined market session.
- Record signal price, fill price, quantity, acknowledgment latency, and rejection status for every order.
- Alert when slippage EWMA exceeds 20 basis points against an 8 basis point backtest assumption.
- Reconcile positions after each weekly order batch and review actual versus 5% target weights.
- Email a monthly report covering fill rate, slippage, P&L z-scores, and rolling Sharpe.
This structure targets roughly one or two urgent SMS events per month during normal operation while preserving lower-severity information in reports.20
Common Monitoring Blind Spots
Monitoring process health without checking data freshness misses a feed frozen at an old timestamp. A frozen feed can pass connectivity tests while producing invalid signals. Another blind spot is assuming that operational monitoring covers regulatory obligations. These systems answer different questions and require separate controls.
Diagnosing From Signal Logs
When a trade is missing, begin with TradingView's Alerts log to confirm that the alert actually fired. A chart marker or backtest event does not establish webhook delivery. Then inspect the downstream webhook log, order record, and broker status in timestamp order.
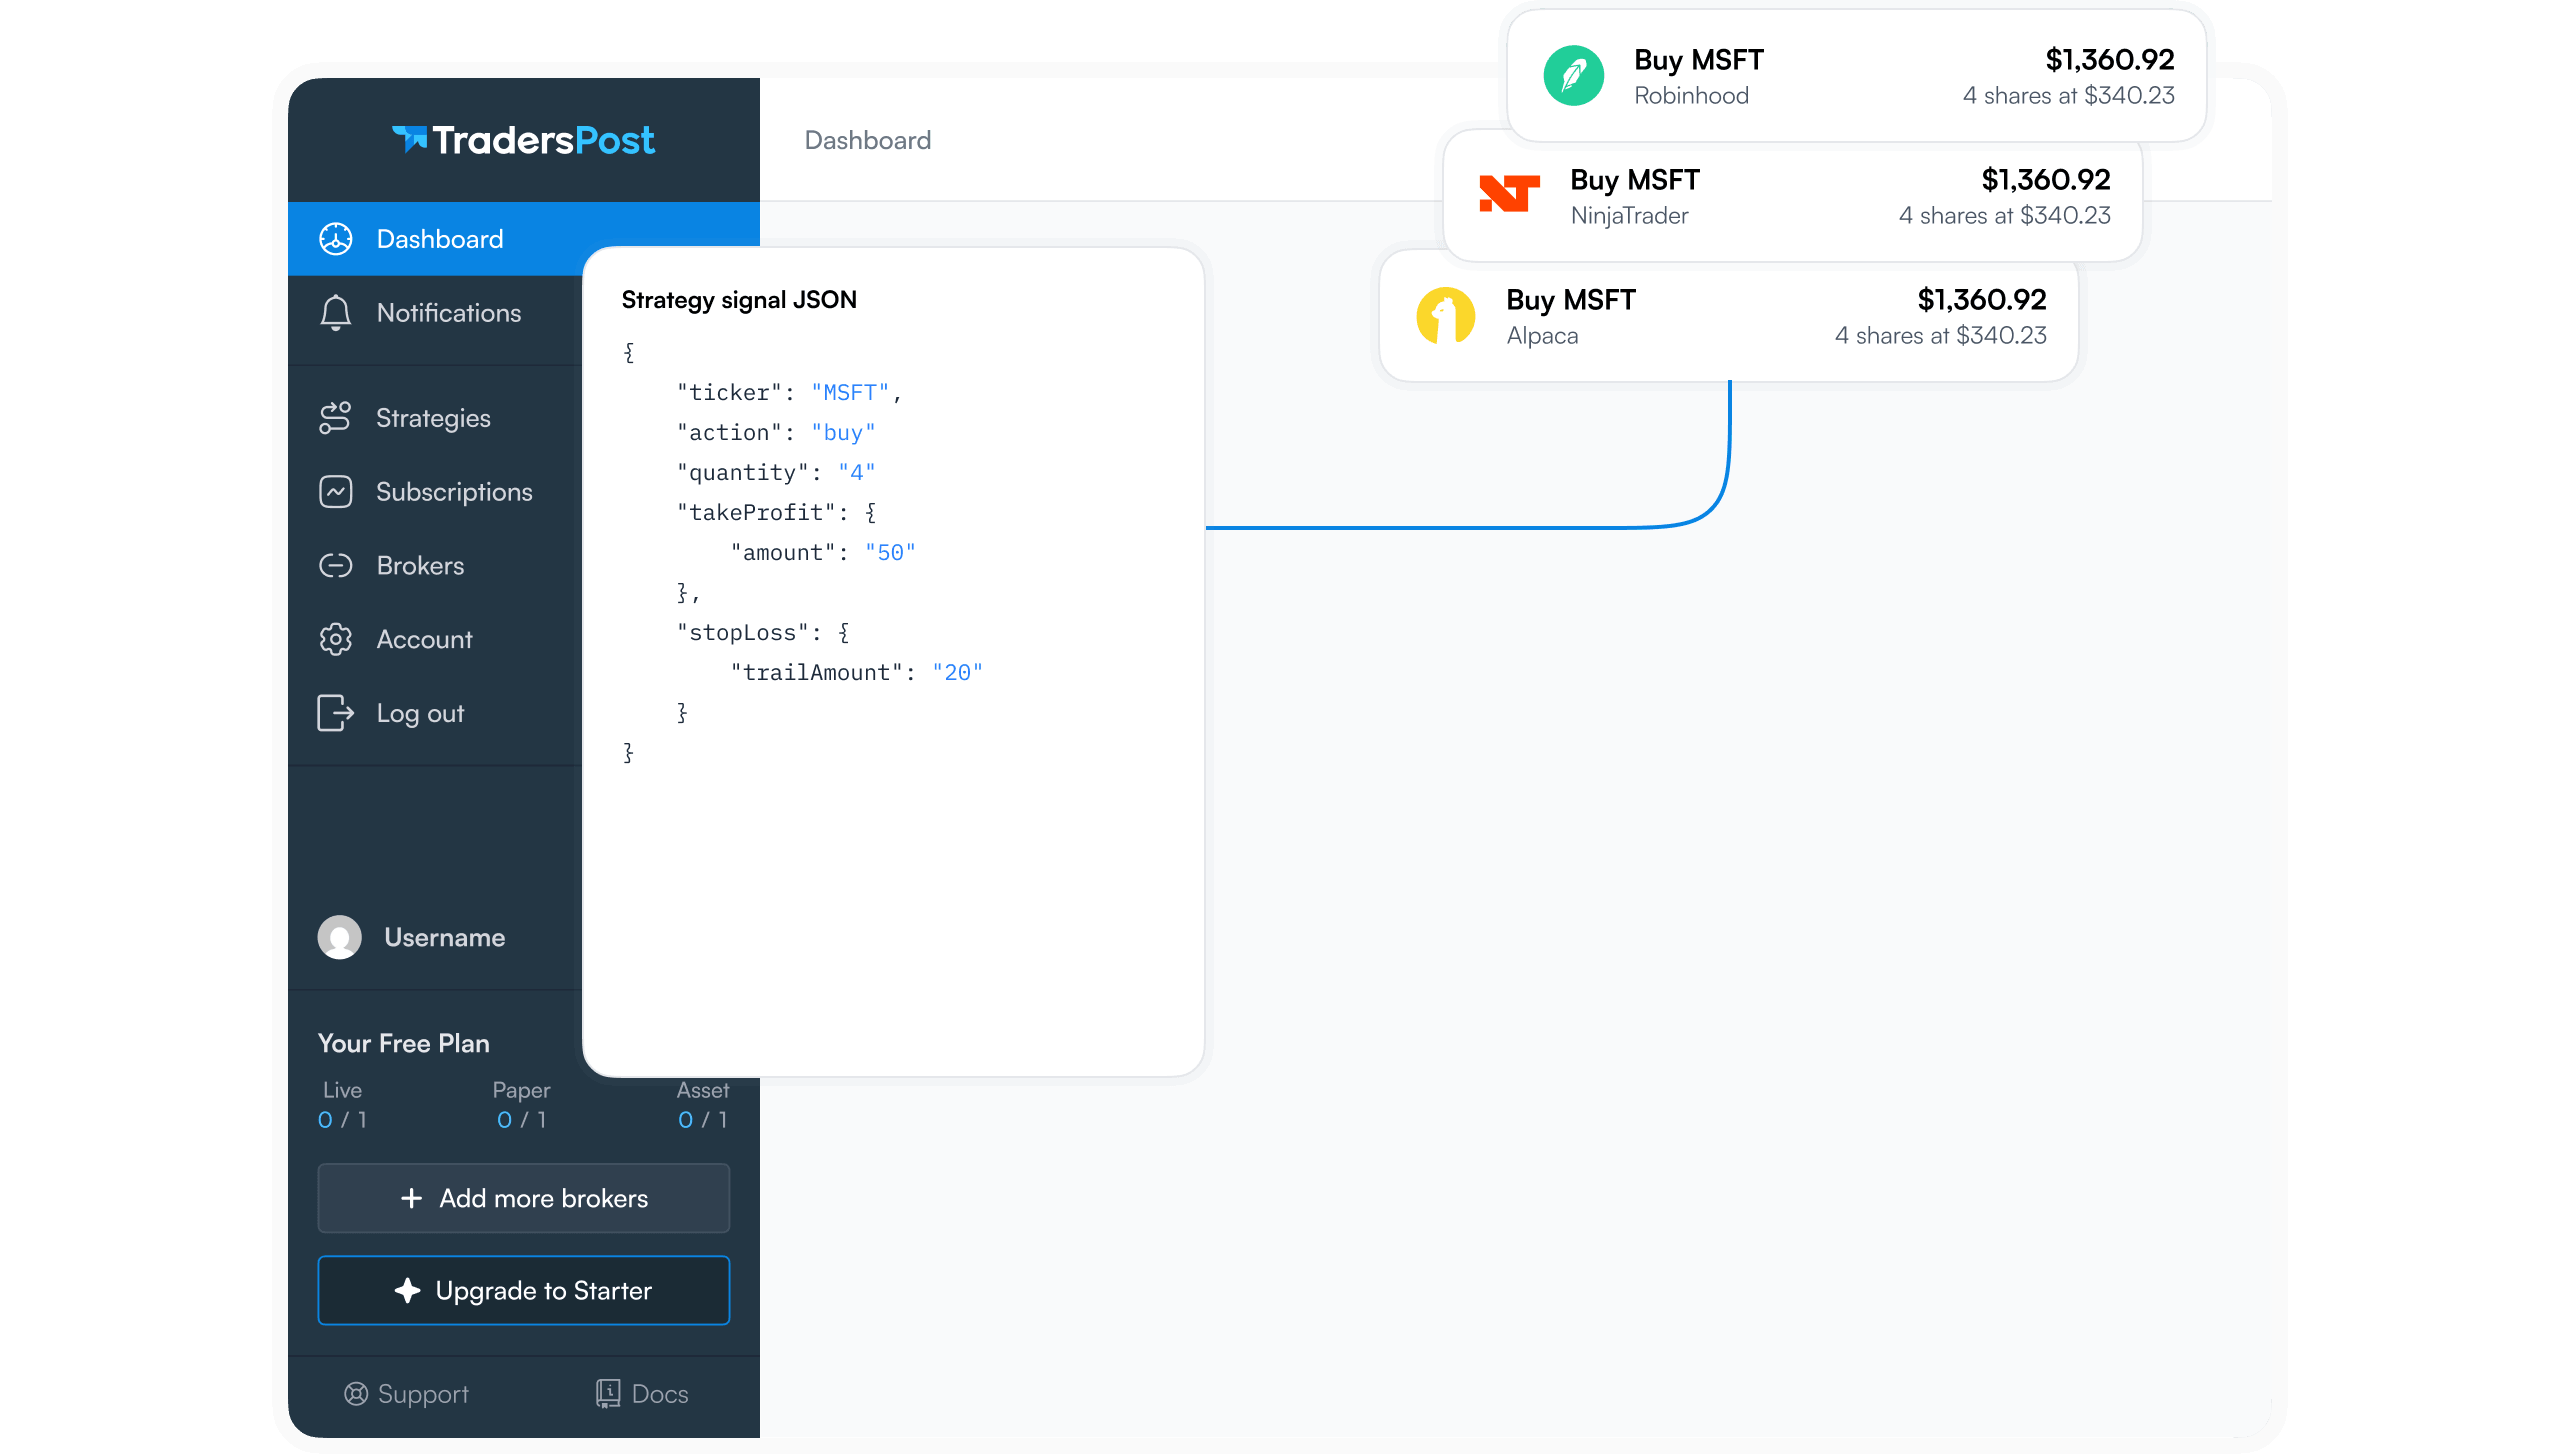
TradersPost records requests sent to a strategy webhook on the Signals page. Opening a signal shows its source, receipt time, and resulting trades. Opening an individual trade provides associated execution information and, for rejected trades, messages that can explain the rejection. This serves as a first-line diagnostic layer alongside custom infrastructure and performance alerts.
Known Constraints to Plan Around
TradersPost is not designed as a high-frequency platform. Failed or rejected orders are never retried, third-party alert webhooks can be delayed or not sent, and signals arriving milliseconds apart can create race conditions. The documented recommendation is to leave 1-5 minutes between signals. Monitoring must therefore detect missing alerts, rejected operations, and timing conflicts rather than assuming automatic recovery.
Build the four monitoring layers in paper or simulated operation first, then test every alert and runbook deliberately. If you route TradingView signals through TradersPost, use its signal and trade logs as one diagnostic source while retaining independent heartbeat, reconciliation, and performance checks.
Bottom Line
- Monitor infrastructure, execution, positions, and performance as separate layers.
- Check freshness and state, not connectivity alone.
- Use sustained, strategy-specific thresholds instead of reacting to isolated trades.
- Reserve urgent channels for failures that require immediate action.
- Keep persistent logs and a tested runbook for every critical alert.
Effective real time algo monitoring makes silent failures visible while evidence is still available. Start with heartbeats and reconciliation, add execution baselines, then compare live results with out-of-sample expectations. TradersPost users can combine the platform's Signals and trade details with independent alerts to shorten diagnosis when a TradingView alert or resulting order does not behave as expected.
Frequently Asked Questions
Monitoring or Risk Controls?
Risk controls block or halt transactions using per-trade or per-session limits. Monitoring tracks cumulative slippage, fill rate, latency, position, and P&L trends. A strategy can pass its controls while failing silently at another layer.
How Often Should Positions Reconcile?
Reconcile at least once per trading session, at the end of day for daily systems and hourly for intraday systems. Run another check after each order batch. Investigate even a one-share or one-contract difference.
How Many Alerts Are Excessive?
More than two or three genuine events per week during normal operation risks alert fatigue. If an alert repeatedly finds no actionable issue, change its threshold or persistence requirement instead of tolerating the noise.
What Does Rising Slippage Mean?
A rising 20-trade slippage EWMA means recent fills are moving farther from signal prices. An increase above 50% that persists for at least 10 trades can indicate changed liquidity, larger relative order size, or slower execution timing.
Can TradingView Alerts Fail?
Third-party webhooks can be delayed or not sent. Repainting Pine Script can also produce a chart event without a corresponding entry in the Alerts log. Check that log first, then downstream signal, trade, and broker records. Manual intervention may be necessary when automation does not complete as expected.
References
1 Algorithmic Trading Monitoring and Alerting for Live Algos
2 Algorithmic Trading Monitoring and Alerting for Live Algos
3 Algorithmic Trading Monitoring and Alerting for Live Algos
4 Algorithmic Trading Monitoring and Alerting for Live Algos
5 Algorithmic Trading Monitoring and Alerting for Live Algos
6 Algorithmic Trading Monitoring and Alerting for Live Algos
7 Algorithmic Trading Monitoring and Alerting for Live Algos
8 Algorithmic Trading Monitoring and Alerting for Live Algos
9 Algorithmic Trading Monitoring and Alerting for Live Algos
10 Algorithmic Trading Monitoring and Alerting for Live Algos
11 Algorithmic Trading Monitoring and Alerting for Live Algos
12 Algorithmic Trading Monitoring and Alerting for Live Algos
13 Algorithmic Trading Monitoring and Alerting for Live Algos
14 Algorithmic Trading Monitoring and Alerting for Live Algos
15 8138 IP Color Visual Alerter User Guide
16 8188 IP Ceiling Speaker User Guide
17 8198 IP PoE+ Ceiling Speaker User Guide
18 Surveillance Techniques for Algo Trading
19 Surveillance Techniques for Algo Trading
20 Algorithmic Trading Monitoring and Alerting for Live Algos